


The Big Idea
Expecting higher inflation
Stephen Stanley | January 8, 2021
This document is intended for institutional investors and is not subject to all of the independence and disclosure standards applicable to debt research reports prepared for retail investors. This material does not constitute research.
The Fed has failed for years to generate inflation at or above its 2% target despite fostering extremely accommodative financial conditions for much of the last decade. The FOMC doubled down on its efforts to convince markets and the public of its intent to meet its inflation target last summer by unveiling a new monetary policy framework that included a formal commitment to attain 2% inflation on average, meaning that it would seek to achieve higher inflation for some time to offset the accumulated shortfall experienced over the last decade. As we enter 2021, market participants may finally be taking the Fed seriously, as inflation expectations are suddenly rising. Inflation above 2% this year should not come as a surprise.
Stubbornly low inflation
Since the Fed was forced to take its federal funds rate target to the zero bound in 2008, inflation has been predominantly below the 2% target. The headline PCE deflator, the Fed’s preferred gauge of inflation, last hit 2% on a December-to-December basis in 2011 (Exhibit 1). Over the period, inflation has averaged roughly 1.5%, not egregiously below the Fed’s target but far enough that a significant cumulative gap has opened up.
Exhibit 1: Headline PCE deflator inflation has run mostly below 2%

Source: BEA.
With this history in mind, Chairman Powell unveiled the FOMC’s new policy framework last summer. The FOMC’s new statement on its longer-run strategy included the following passage:
“In order to anchor longer-term inflation expectations at this level, the Committee seeks to achieve inflation that averages 2 percent over time, and therefore judges that, following periods when inflation has been running persistently below 2 percent, appropriate monetary policy will likely aim to achieve inflation moderately above 2 percent for some time.”
Market participants took the new statement to indicate that the Fed would be conducting an easier policy over time than would have been the case under the prior framework. In general, fed funds and other money market futures suggest that investors are on board with the FOMC’s projections that it is likely to keep the fed funds rate target at the zero bound for at least three more years. However, there was not, at least initially, much evidence that market participants thought that the Fed would be able to push inflation higher.
A fresh outlook in 2021
As the calendar turned to a new year, and market participants began to think more seriously about what a post-pandemic economy would bring, we may be seeing a shift in the Fed’s perceived ability to create inflation. TIPS break-evens have been rising noticeably in recent days.
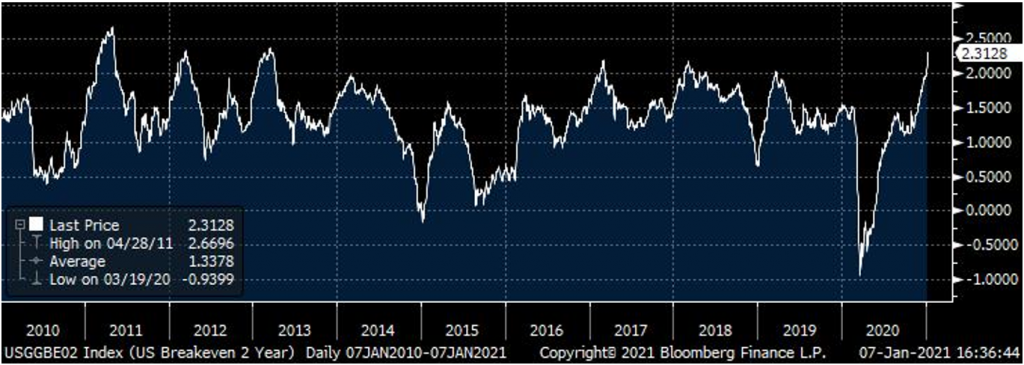
The 2-year breakeven inflation rate has risen by almost 100 bp since Thanksgiving and by 30 bp within the last week (Exhibit 2). At 2.31%, the gauge is at its highest since 2013 and is within a few basis points of its highest reading since 2011, a period when oil prices were spiking to over $100 a barrel.
Exhibit 2: A rising 2-Year TIPS breakeven rate
Source: Bloomberg.
Looking further into the future, market participants’ expectations for inflation over the next five years have similarly jumped (Exhibit 3). The move over a longer time horizon is less dramatic bit still substantial. The current reading of 2.11% is a nearly 2-year high and within a few basis points of the highest level since 2013, and the measure is up by about 15 bp just this week.
Exhibit 3: A rising 5-Year TIPS breakeven rate

Source: Bloomberg.
Finally, to gauge market participants’ perception regarding the long-term inflation outlook, we can look at the 5-year breakeven rate five years forward (Exhibit 4). That is, what do people expect in the second half of the next 10 years (in the current case, for the period from 2026 to 2030)? Longer-term inflation expectations have also risen but are far more muted, especially compared to a decade ago, when many were making bets that QE would generate a steep run-up in prices.
Exhibit 4: 5-Year 5-Year-Forward TIPS Breakeven Rate

Source: Bloomberg.
Room to Go
So, it appears that the Fed may finally be having some degree of success in convincing market players that it will do what it takes to achieve 2% average inflation. However, the current TIPS breakevens suggest that the Fed still has some wood to chop.
First of all, note that TIPS breakevens are tied to the CPI, not the PCE deflator. The former historically tends to run around 0.25% higher due to differences in methodology and coverage. An expectation of meeting the Fed’s 2% target would necessitate TIPS breakevens of about 2.25%. By that measure, only the 2-year breakeven gauge is there.
However, given its new average inflation targeting strategy, the Fed is aiming to overshoot its 2% target for some time to achieve a 2% average over time. In fact, the forward guidance offered by the FOMC on lifting off from the zero bound indicates that the Committee is not planning to raise rates “until inflation has risen to 2 percent and is on track to moderately exceed 2 percent for some time.”
Numerous Fed officials have signaled since last summer that they would be willing to tolerate inflation of as high as 2.5% for a while to help bring inflation expectations higher and achieve a 2% long-term average. Chicago Fed President Evans went a step further this week: “I welcome above-2% inflation. Frankly, if we got 3% inflation, that would not be so bad.”
The TIPS breakevens laid out above, if taken literally, imply that markets think the Fed might be able to get to roughly 2% inflation as measured by the PCE deflator over the next two years but then the gauge will ease back below the target, settling at somewhere close to 1.8%, not far from the prevailing trend from 2016 through 2019.
Ironically, the Fed’s own inflation outlook appears to be a mirror image of the TIPS breakeven curve. The December FOMC projections showed that officials expect inflation to run below 2% in 2021 and 2022 and to finally move to target in 2023. Presumably, officials would then project inflation to continue to creep modestly higher in the next few years, as the Fed keeps policy easy to generate above-target inflation for “some time.” So, in some sense, the markets are currently giving the Fed more credit for its inflation-generating capability than the FOMC itself is, at least over the next few years.
The Fed may be more successful than it expects. Given the cost pressures caused by the pandemic and the immense amount of money that is going to be available to consumers when the economy reopens later this year, I would not be surprised to see inflation move above 2% in 2021 and stay there for a while.