The Long and Short
A steeper curve presents buying opportunity in long-dated HCSERV bonds
This material is a Marketing Communication and does not constitute Independent Investment Research.
Investors looking for additional yield in the relatively stable HMO sector should consider the Health Care Service Corporation (HCSERV (A3/A+/A-) which has one of the steeper 10s/30s curves among its lower rated peers. While the credit has tightened considerably over the past 6 months along with HMO peers, its curve has steepened by 15 bp as the 10-year bond has rallied slightly through ANTM. Investors can take advantage of the steeper curve and move into a credit that is both lower levered and has a much stronger risk-based capital ratio than ANTM.
Relative to Anthem Inc. (ANTM – Baa2/A/BBB), HCSERV’s 10s/30s curve stands at 40 bp (g-spread) while ANTM’s curve is currently at 35 bp (g-spread). Additionally, when HCSERV priced the bonds in May 2020, the curve at pricing was only 25 bp (155 bp on the 10-year versus 180 bp on the 30-year). HCSERV has long managed its risk-based capital (RBC) ratio above 700%, and it currently resides at just over 1200%, which is one of the highest among all of the HMOs and compares very favorably to ANTM’s which is roughly 250%. HCSERV’s risk-based capital redundancy is considered “AAA” relative to “AA” at ANTM, and the company is currently levered below 1.5x versus 2.4x at ANTM.
Exhibit 1. Single A – BBB HMO Spread Comparison (10-year to 30-year)
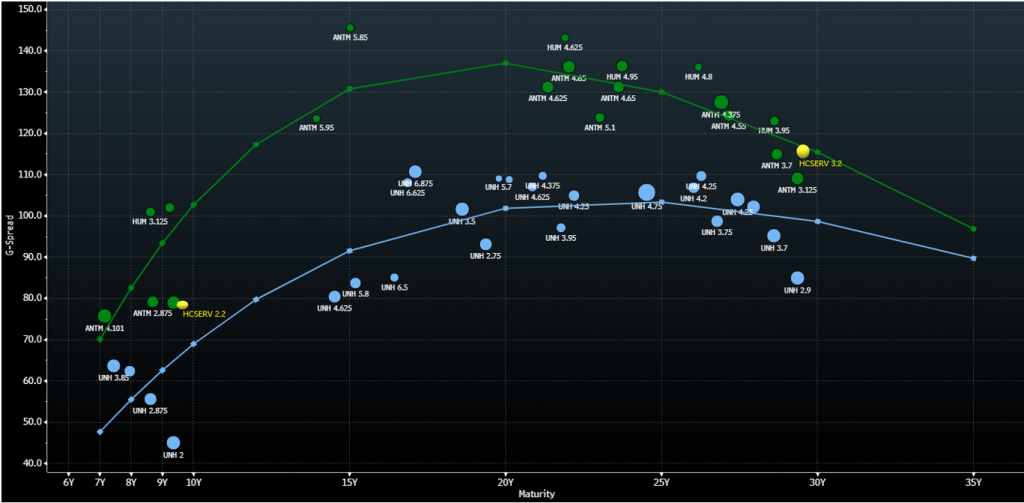
Source: Bloomberg TRACE; Amherst Pierpont Securities
Strength in members
Founded in 1936, HCSERV is actually the nation’s fifth largest health insurer and the largest customer owned health insurer in the U.S. by membership with over 16 million members. It is an independent licensee of the Blue Cross Blue Shield Association with core markets of Illinois, Texas, Oklahoma, New Mexico and Montana. Illinois and Texas remain its two largest markets with membership of 8.5 million and 5.7 million, respectively. Combined, Illinois and Texas account for roughly 89% of total members. While competition is strong in all five states that HCSERV operates in, the Blue Cross Blue Shield brand provides a sizeable competitive advantage for HCSERV for both network relationships and customer recognition.
As of 8/31/20, HCSERV’s membership increased nearly 2% from year-end 2019. Nearly 90% of the company’s membership base comes from commercial segments, i.e. group self-funded, group fully insured and individuals under 65 years of age, with only 10% from government sponsored segments of Medicare and Medicaid. By comparison nearly 30% of ANTM membership is from government sponsored programs. While government membership is fueling overall membership growth at ANTM, there tends to be more revenue and earnings volatility associated with the government segment. This is due to the size of the contracts, as wins/losses can create huge earnings swings. Additionally, there is more reimbursement pressure associated with government contracts. By maintaining strong commercial membership levels, HCSERV is able spread both risk and medical expenditures across a large enough membership base which helps to keep rising costs at a minimum. Currently, HCSERV’s administrative costs account for roughly 10% of each health care premium dollar.
Capitalization at the “AAA” level
HCSERV has long maintained strong capitalization and has financial strength ratings of AA- from S&P, A1 from Moody’s and A from A.M. Best. S&P noted when HCSERV came to market that the company’s capital levels are “comfortably redundant” at the AAA level. HCSERV has approximately $39 billion in statutory revenue and nearly $19 billion of statutory capital. HCSERV’s $2 billion three part bond deal issued at the end of May is the company’s only senior debt outstanding. The deal was essentially leverage neutral as proceeds were used to repay the $1.75 billion of borrowings from the Federal Home Loan Bank. Even after the deal its leverage remains low and favorable to peers at just below 1.5x debt to pre-tax income. This compares favorably to UNH’s leverage of 1.7x, HUM’s of 2.1x and ANTM’s of 2.4x. Additionally, HCSERV’s current debt to statutory capital ratio is just under 10%, which is considered very low. Once again this compares very favorably to its peers’ debt to total capitalization ratios with UNH at 41.8%, HUM at 33.7% and ANTM at 39.2%.
HCSERV has maintained an RBC ratio above 700% since 2015, and prior to that it was maintained above 500%. This is important as publicly traded peers typically maintain RBC ratios in the 200%-275%, while privately owned BCBS peers have RBC ratios in the 250%-500% range. With expectations for HCSERV to end 2020 with an RBC ratio at over 1400%, the company is likely to have the strongest ratio in the HMO space.
Exhibit 2. HCSERV’s RBC trend (2015-2021E)

*2020 and 2021 estimated by S&P
Source: S&P Global Ratings; Amherst Pierpont Securities
Outlooks are stable
HCSERV’s ratings all currently have stable outlooks. S&P’s stable outlook reflects its view that HCSERV will be able to navigate the impact of COVID without any deterioration of credit quality. S&P also noted that the issuance in May does not affect the company’s AA- financial strength rating. While S&P notches the ratings of the notes one notch from the financial strength rating, the notching purely reflects the subordination of the debt relative to policyholder claims in the event of insolvency, and does not represent any weakness in the credit. Fitch’s stable outlook reflects its view that the balance sheet will continue to remain strong and any challenges to profitability presented by COVID, will not materially impact its strong capitalization. Additionally, the approval of vaccines is a positive step in creating effective immunization and helping to return the US and the world to a more normal social and economic environment. The sooner we reach herd immunity, the better for HMOs in reducing increased medical costs associated with the pandemic.
This material is intended only for institutional investors and does not carry all of the independence and disclosure standards of retail debt research reports. In the preparation of this material, the author may have consulted or otherwise discussed the matters referenced herein with one or more of SCM’s trading desks, any of which may have accumulated or otherwise taken a position, long or short, in any of the financial instruments discussed in or related to this material. Further, SCM may act as a market maker or principal dealer and may have proprietary interests that differ or conflict with the recipient hereof, in connection with any financial instrument discussed in or related to this material.
This message, including any attachments or links contained herein, is subject to important disclaimers, conditions, and disclosures regarding Electronic Communications, which you can find at https://portfolio-strategy.apsec.com/sancap-disclaimers-and-disclosures.
Important Disclaimers
Copyright © 2026 Santander US Capital Markets LLC and its affiliates (“SCM”). All rights reserved. SCM is a member of FINRA and SIPC. This material is intended for limited distribution to institutions only and is not publicly available. Any unauthorized use or disclosure is prohibited.
In making this material available, SCM (i) is not providing any advice to the recipient, including, without limitation, any advice as to investment, legal, accounting, tax and financial matters, (ii) is not acting as an advisor or fiduciary in respect of the recipient, (iii) is not making any predictions or projections and (iv) intends that any recipient to which SCM has provided this material is an “institutional investor” (as defined under applicable law and regulation, including FINRA Rule 4512 and that this material will not be disseminated, in whole or part, to any third party by the recipient.
The author of this material is an economist, desk strategist or trader. In the preparation of this material, the author may have consulted or otherwise discussed the matters referenced herein with one or more of SCM’s trading desks, any of which may have accumulated or otherwise taken a position, long or short, in any of the financial instruments discussed in or related to this material. Further, SCM or any of its affiliates may act as a market maker or principal dealer and may have proprietary interests that differ or conflict with the recipient hereof, in connection with any financial instrument discussed in or related to this material.
This material (i) has been prepared for information purposes only and does not constitute a solicitation or an offer to buy or sell any securities, related investments or other financial instruments, (ii) is neither research, a “research report” as commonly understood under the securities laws and regulations promulgated thereunder nor the product of a research department, (iii) or parts thereof may have been obtained from various sources, the reliability of which has not been verified and cannot be guaranteed by SCM, (iv) should not be reproduced or disclosed to any other person, without SCM’s prior consent and (v) is not intended for distribution in any jurisdiction in which its distribution would be prohibited.
In connection with this material, SCM (i) makes no representation or warranties as to the appropriateness or reliance for use in any transaction or as to the permissibility or legality of any financial instrument in any jurisdiction, (ii) believes the information in this material to be reliable, has not independently verified such information and makes no representation, express or implied, with regard to the accuracy or completeness of such information, (iii) accepts no responsibility or liability as to any reliance placed, or investment decision made, on the basis of such information by the recipient and (iv) does not undertake, and disclaims any duty to undertake, to update or to revise the information contained in this material.
Unless otherwise stated, the views, opinions, forecasts, valuations, or estimates contained in this material are those solely of the author, as of the date of publication of this material, and are subject to change without notice. The recipient of this material should make an independent evaluation of this information and make such other investigations as the recipient considers necessary (including obtaining independent financial advice), before transacting in any financial market or instrument discussed in or related to this material.
Important disclaimers for clients in the EU and UK
This publication has been prepared by Trading Desk Strategists within the Sales and Trading functions of Santander US Capital Markets LLC (“SanCap”), the US registered broker-dealer of Santander Corporate & Investment Banking. This communication is distributed in the EEA by Banco Santander S.A., a credit institution registered in Spain and authorised and regulated by the Bank of Spain and the CNMV. Any EEA recipient of this communication that would like to affect any transaction in any security or issuer discussed herein should do so with Banco Santander S.A. or any of its affiliates (together “Santander”). This communication has been distributed in the UK by Banco Santander, S.A.’s London branch, authorised by the Bank of Spain and subject to regulatory oversight on certain matters by the Financial Conduct Authority (FCA) and the Prudential Regulation Authority (PRA).
The publication is intended for exclusive use for Professional Clients and Eligible Counterparties as defined by MiFID II and is not intended for use by retail customers or for any persons or entities in any jurisdictions or country where such distribution or use would be contrary to local law or regulation.
This material is not a product of Santander´s Research Team and does not constitute independent investment research. This is a marketing communication and may contain ¨investment recommendations¨ as defined by the Market Abuse Regulation 596/2014 ("MAR"). This publication has not been prepared in accordance with legal requirements designed to promote the independence of research and is not subject to any prohibition on dealing ahead of the dissemination of investment research. The author, date and time of the production of this publication are as indicated herein.
This publication does not constitute investment advice and may not be relied upon to form an investment decision, nor should it be construed as any offer to sell or issue or invitation to purchase, acquire or subscribe for any instruments referred herein. The publication has been prepared in good faith and based on information Santander considers reliable as of the date of publication, but Santander does not guarantee or represent, express or implied, that such information is accurate or complete. All estimates, forecasts and opinions are current as at the date of this publication and are subject to change without notice. Unless otherwise indicated, Santander does not intend to update this publication. The views and commentary in this publication may not be objective or independent of the interests of the Trading and Sales functions of Santander, who may be active participants in the markets, investments or strategies referred to herein and/or may receive compensation from investment banking and non-investment banking services from entities mentioned herein. Santander may trade as principal, make a market or hold positions in instruments (or related derivatives) and/or hold financial interest in entities discussed herein. Santander may provide market commentary or trading strategies to other clients or engage in transactions which may differ from views expressed herein. Santander may have acted upon the contents of this publication prior to you having received it.
This publication is intended for the exclusive use of the recipient and must not be reproduced, redistributed or transmitted, in whole or in part, without Santander’s consent. The recipient agrees to keep confidential at all times information contained herein.


