


Uncategorized
Tighter spreads through Treasury supply
admin | December 11, 2020
This document is intended for institutional investors and is not subject to all of the independence and disclosure standards applicable to debt research reports prepared for retail investors. This material does not constitute research.
The list of bullish influences on risks spreads is now almost a mantra. Fiscal stimulus, an accommodative Fed and a likely pandemic rebound all help risk assets. The list should also include record net Treasury supply. A surplus flow in the riskless asset historically has come along with tighter spreads. That has been true for decades, and even as recently as this fall. It is an important reason why spreads between risk assets and the Treasury curve could set records in the year ahead.
It takes two assets to create a spread tango
Any yield spread between two assets reflects influences on both sides, but often the focus falls on the risk asset and not the riskless benchmark. Spread changes routinely get attributed only to shifts in the risk asset. Shifting yields in the risk asset could involve fundamentals of credit, prepayment, volatility or liquidity, for instance, or the technicals of supply and demand. The same dynamics hold for the riskless benchmark, but because it is riskless, supply and demand alone prevail.
The clearest example of the influence of riskless supply and demand is in the interest rate swap market. The swap market is one place where supply and demand for interest rate exposure has few practical limits. Margin and clearing requirements have changed over time, but almost any institutional counterparty can still pay the fixed rate on a swap and supply the market with yield and duration. Supply is not limited by funding needs, which apply in the cash market, including the Treasury market. Because swap supply is practically unlimited, comparing a swap yield to a Treasury yield of the same maturity can highlight the impact of shifting supply and demand in the Treasury market.
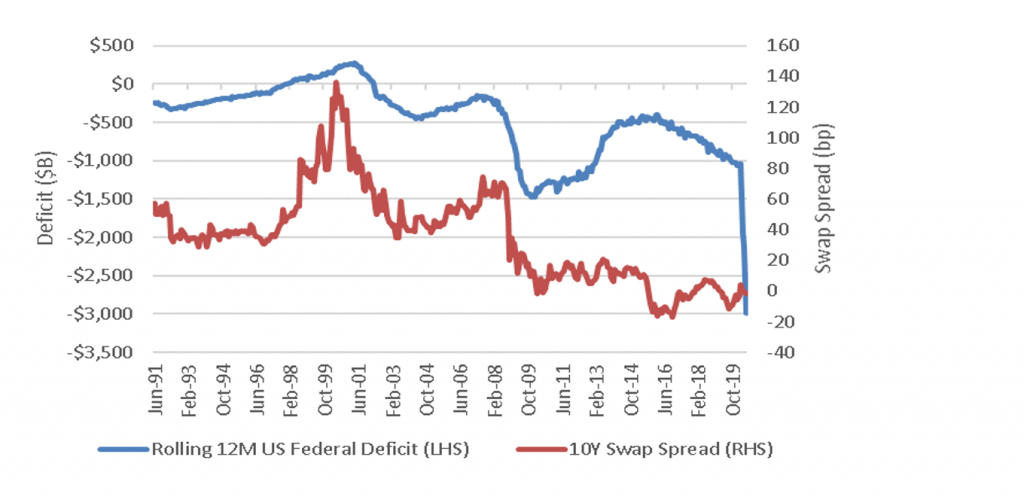
When the supply of Treasury debt is unusually high, all else equal, the yield on the riskless asset should rise and the spread between swap and Treasury yields should narrow. And when the supply of Treasury debt is low, the yield on the riskless asset should drop and the spread should widen. In fact, that is the pattern that shows up over long periods (Exhibit 1). The spread between 10-year swaps and Treasury notes reached its widest point, nearly 140 bp, in the late 1990s when the US ran a budget surplus and began to draw down the supply of riskless debt. After the 2008 financial crisis, by contrast, when deficit spending accelerated and flooded the market with riskless debt, the spread between 10-year swaps and notes dropped toward zero. Based on the level of US deficit in 2020 and potentially for years to come, spreads of swaps and all risk assets to the Treasury benchmark look highly likely to tighten.
Exhibit 1: A deepening deficit historically tightens swap and other risk spreads
Source: Bloomberg, Amherst Pierpont Securities
It is already happening
Heavy net supply of Treasury debt is already influencing spreads. Analysts from the Bank for International Settlements looked recently at the spread between US 10-year debt and German 10-year debt, both the riskless benchmarks for their respective markets. Between June and October, the US increased the nominal net supply of debt—after excluding central bank purchases—by between 2% and 5% a month. Germany reduced net supply by between 1% and 12% a month. After accounting for possible differences in the path of Fed and ECB policy rates, US yields rose by nearly 50 bp relative to German yields. Differences in expected economic activity and inflation could explain the differences in yield. But swap spreads highlight supply and demand. German 10-year swap spreads widened from August into December as the supply of the local riskless asset fell while US 10-year swap spread remained roughly unchanged as the supply of Treasury debt rose.
Potential for record tight spreads
Investors looking to historic spreads for guidance should consider that US deficits and the net supply of Treasury debt are setting records and should continue to run at historically high levels, according to the Congressional Budget Office. The market should have already priced some of the forward supply in, but the possibility of pandemic relief and other forms of fiscal spending on housing policy, education and infrastructure in the years ahead could keep deficits rolling. History, in those circumstances, may underestimate how tight risk spreads could go.
* * *
The view in rates
The Treasury yield curve has moved just below its steepest level of the year with 2s10s at 78 bp and 5s30s at 126 bp. The spread between 10-year notes and TIPS suggests the steepening reflects rising expectations for inflation, and that spread has climbed from around 170 bp in October and November toward 190 bp lately. Prospects of fiscal stimulus, pandemic recovery through 2021 and a very easy Fed all should fuel further steepening. Heavy Treasury supply is adding steady pressure, too. Implied interest rate volatility remains low, helped by high levels of market liquidity and a Fed likely to keep rates low and QE running through 2021.
The view in spreads
Very bullish. Beyond the influence of net Treasury supply, fiscal stimulus, pandemic recovery and Fed policy should also keep spreads steadily tighter through 2021. Weaker credits should outperform stronger credits, with high yield topping investment grade debt and both topping safe assets such as agency MBS and Treasury debt.
The view in credit
As Stephen Stanley points out elsewhere in this issue, consumers in aggregate are coming out of 2020 with a $5 trillion gain in net worth. Aggregate savings are up, home values are up and investment portfolios are up. Consumers have not added much debt. Although there is an underlying distribution of haves and have nots, the aggregate consumer balance sheet is strong. Corporate balance sheets have taken on substantial amounts of debt and will need earnings to rebound for either debt-to-EBITDA or EBITDA-to-interest-expense to drop back to better levels. Credit in the next few months could see some volatility as Covid begins forcing shutdown of some economic activity and distribution of vaccines potentially hits some logistical potholes. But distribution and vaccine uptake through next year should put a floor on fundamental risk with businesses and households most affected by pandemic—personal services, restaurants, leisure and entertainment, travel and hotels—bouncing back the most.