Uncategorized
Strategy shifts ahead of a return to normalcy
admin | December 4, 2020
This material is a Marketing Communication and does not constitute Independent Investment Research.
The November rally was enough to push the investment grade corporate bond index into positive territory for the year as spreads tightened below last winter’s levels. As markets turn the corner, our updated sector recommendations should guide investors looking to maximize excess return in 2021.
We are making numerous changes reflecting our updated views on the market for the first half of next year, many of which were expressed in our recently published outlook for 2021 (APS Strategy: Corporate Bond Outlook 2021). Most notably, we are moving our views to an overweight on energy, financial companies, and REITs, while moving utility credits to an underweight. We are also taking banks and consumer non-cyclical to market weight from their previous overweight views.
Below we provide a summary of how APS expects sectors within the IG Index to perform for the next several months, on an excess return basis (total return net of commensurate UST return). These weightings serve as a proxy for how we recommend that portfolio managers should position their holdings relative to the broad IG corporate bond market.
Exhibit 1. APS Sector Recommendations for December 2020
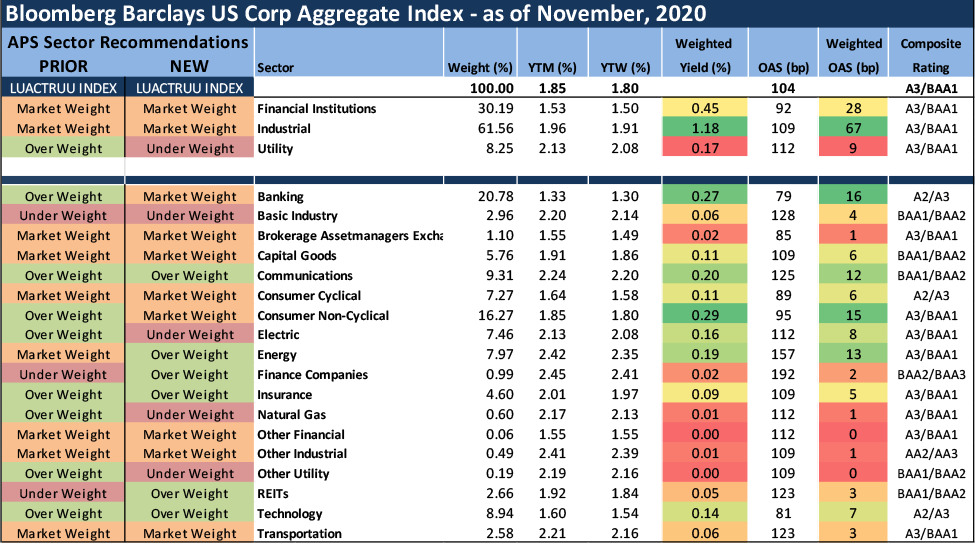
Source: Amherst Pierpont, Bloomberg/Barclays US Corp Index
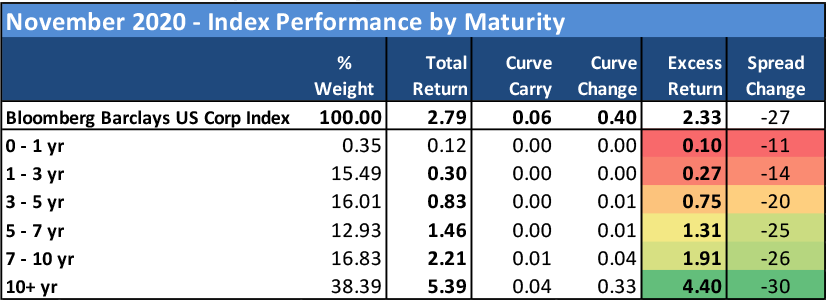
November was pure “risk-on” for the IG Corporate Bond Index, as the aggregate OAS tightened by 27 bp for the month, producing a 2.33% excess return – the best monthly performance since May of this year. Total return was 2.79%, as the long-end of the curve flattened, producing outperformance among longer-dated securities within the Index. The rally was enough to edge the annual performance of the IG Index into positive territory, as spreads remain roughly flat versus year-end, and year-to-date excess return sits at +0.43% as of month-end.
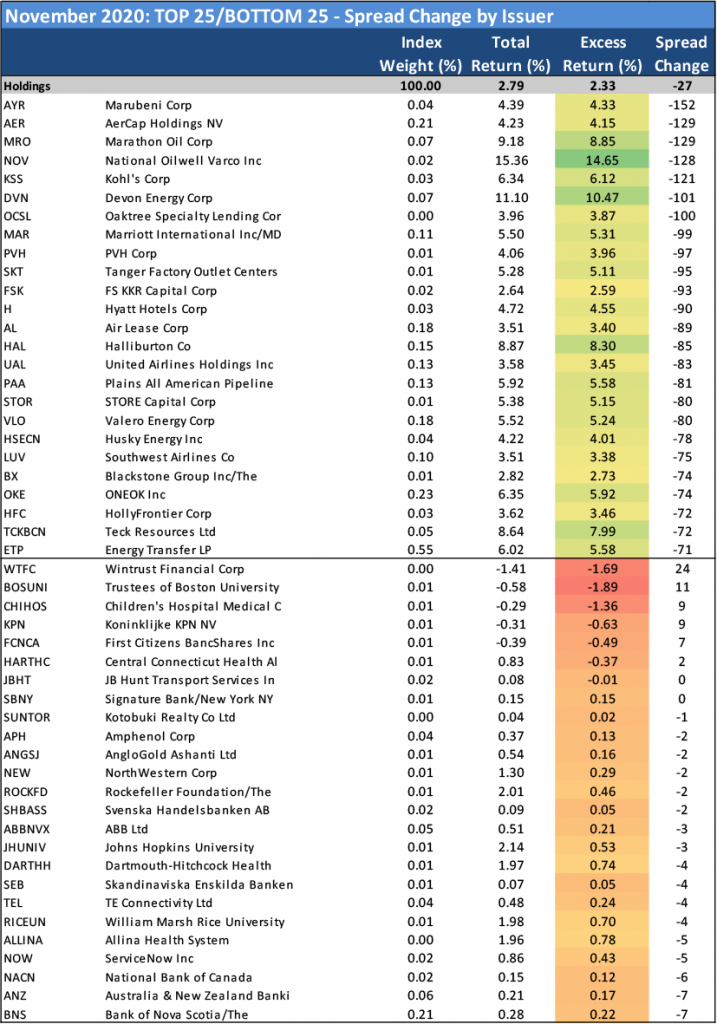
Energy (4.00% excess return) led the charge as oil prices surged roughly 27% from the previous month-end. For the first time in four months, another sector managed to beat out finance companies for the best performance in the Index, but the segment still provided an impressive 3.90% excess return with spreads tightening roughly 70 bp in aggregate. Several developments in COVID-19 vaccines spurred a massive recovery in any credits related to air travel, including the aircraft lessors, which make up a large component of finance companies. The subgroup is among the focus topics in our outlook for 2021 (APS Strategy: Corporate Bond Outlook 2021). Transportation (3.19%), communications (2.93%) and basic industry (2.79%) rounded out the top 5, with the former two demonstrating the market’s preference for longer-duration segments. The weakest returns in November were primarily among financials, with banking (1.39%), broker/asset managers (1.74%) and REITs (1.76%) all underperforming the broader Index. Technology (1.95%) and consumer cyclical (2.00%) rounded out the bottom 5, as investors sought higher beta opportunities elsewhere.
For the first time since July, the IG new issue calendar failed to outpace the monthly results for 2019, as issuance dropped 9% YoY to just over $100 billion for November. Verizon (VZ: Baa1/BBB+) helped narrow that gap with a massive 5-part $12 billion debt launch, earmarked for spectrum purposes and retirement of debt – it represented one of the five largest debt launches of 2020. Still, the YTD total remains roughly 56% above 2019 through the first 11 months of the year, and on record-setting pace to finish over $1.9 trillion. While early debt redemptions and retirements still remain the primary use of proceeds for the IG new issue market, we began to see at least a few instances of corporate management teams pursuing debt-funded share repurchases in November. This trend of increased shareholder enhancement is one we expect to accelerate in the coming year, and a credit consideration we address at length in our Outlook piece referenced above.
Exhibit 2. Supply Recap
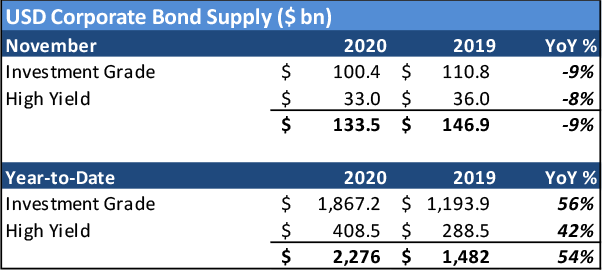
Source: Bloomberg LP
Exhibit 3. Energy and finance companies lead the market tighter
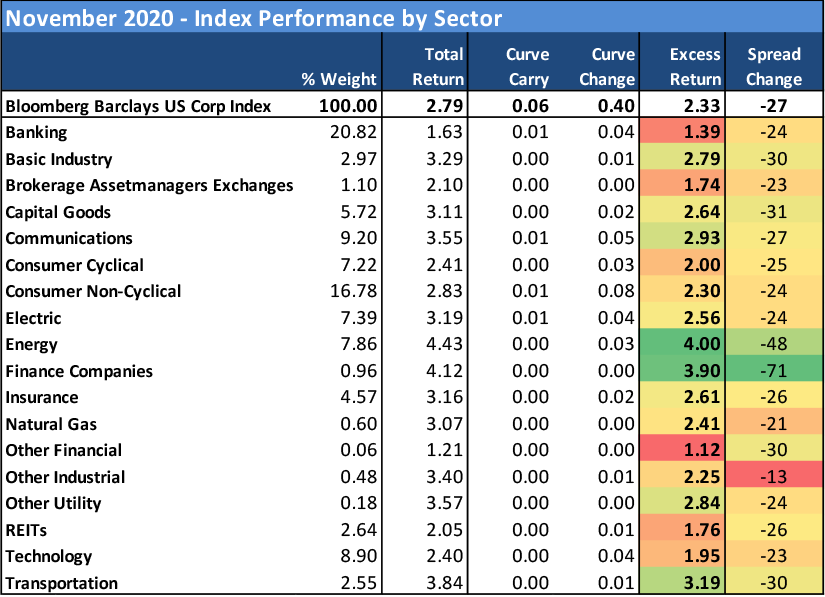
Source: Bloomberg Barclays US Corp Index
Exhibit 4. “Down-in-credit” trade remains prominent in November
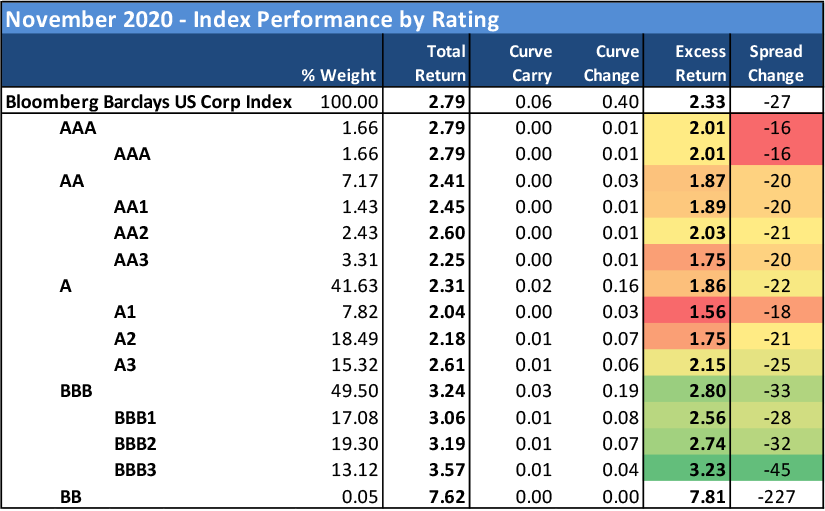
Source: Bloomberg Barclays US Corp Index
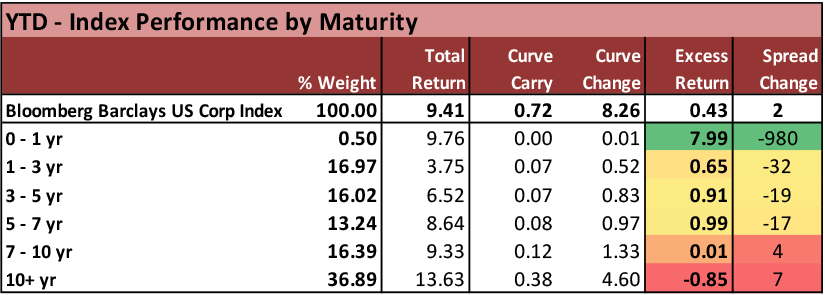
Exhibit 5. Curve flattening favored long-dated maturities
Source: Bloomberg Barclays US Corp Index
Exhibit 6. Aircraft lessors, retail and energy among the month’s top performers
Source: Bloomberg Barclays US Corp Index
IG Corporate Bond Index – Year-to-Date (YTD) Return Attribution Summary
Exhibit 7. Energy remains in negative territory YTD despite recent rally
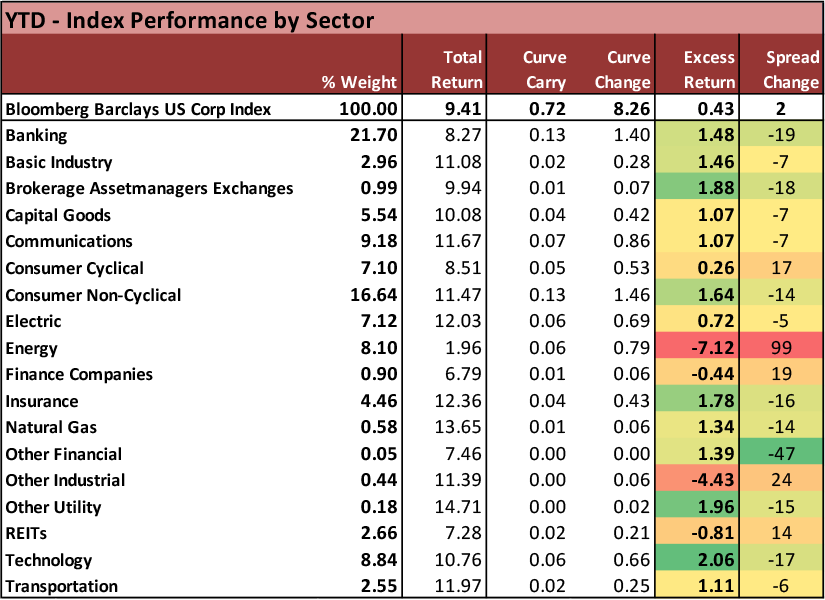
Source: Bloomberg Barclays US Corp Index
Exhibit 8. Single-A credit still top performer on a YTD basis, BBB gaining ground
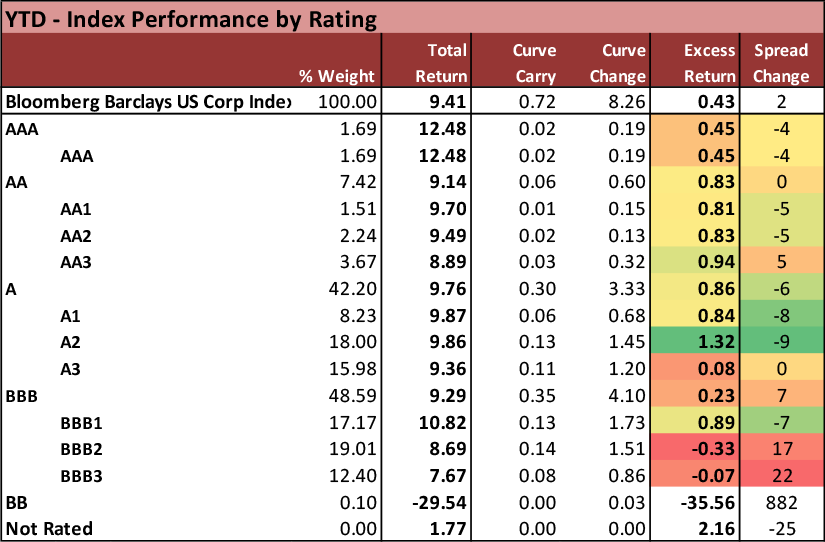
Source: Bloomberg Barclays US Corp Index
Exhibit 9. Extraordinary total return in the long-end somewhat offset by lagging excess return YTD
Source: Bloomberg Barclays US Corp Index
This material is intended only for institutional investors and does not carry all of the independence and disclosure standards of retail debt research reports. In the preparation of this material, the author may have consulted or otherwise discussed the matters referenced herein with one or more of SCM’s trading desks, any of which may have accumulated or otherwise taken a position, long or short, in any of the financial instruments discussed in or related to this material. Further, SCM may act as a market maker or principal dealer and may have proprietary interests that differ or conflict with the recipient hereof, in connection with any financial instrument discussed in or related to this material.
This message, including any attachments or links contained herein, is subject to important disclaimers, conditions, and disclosures regarding Electronic Communications, which you can find at https://portfolio-strategy.apsec.com/sancap-disclaimers-and-disclosures.
Important Disclaimers
Copyright © 2026 Santander US Capital Markets LLC and its affiliates (“SCM”). All rights reserved. SCM is a member of FINRA and SIPC. This material is intended for limited distribution to institutions only and is not publicly available. Any unauthorized use or disclosure is prohibited.
In making this material available, SCM (i) is not providing any advice to the recipient, including, without limitation, any advice as to investment, legal, accounting, tax and financial matters, (ii) is not acting as an advisor or fiduciary in respect of the recipient, (iii) is not making any predictions or projections and (iv) intends that any recipient to which SCM has provided this material is an “institutional investor” (as defined under applicable law and regulation, including FINRA Rule 4512 and that this material will not be disseminated, in whole or part, to any third party by the recipient.
The author of this material is an economist, desk strategist or trader. In the preparation of this material, the author may have consulted or otherwise discussed the matters referenced herein with one or more of SCM’s trading desks, any of which may have accumulated or otherwise taken a position, long or short, in any of the financial instruments discussed in or related to this material. Further, SCM or any of its affiliates may act as a market maker or principal dealer and may have proprietary interests that differ or conflict with the recipient hereof, in connection with any financial instrument discussed in or related to this material.
This material (i) has been prepared for information purposes only and does not constitute a solicitation or an offer to buy or sell any securities, related investments or other financial instruments, (ii) is neither research, a “research report” as commonly understood under the securities laws and regulations promulgated thereunder nor the product of a research department, (iii) or parts thereof may have been obtained from various sources, the reliability of which has not been verified and cannot be guaranteed by SCM, (iv) should not be reproduced or disclosed to any other person, without SCM’s prior consent and (v) is not intended for distribution in any jurisdiction in which its distribution would be prohibited.
In connection with this material, SCM (i) makes no representation or warranties as to the appropriateness or reliance for use in any transaction or as to the permissibility or legality of any financial instrument in any jurisdiction, (ii) believes the information in this material to be reliable, has not independently verified such information and makes no representation, express or implied, with regard to the accuracy or completeness of such information, (iii) accepts no responsibility or liability as to any reliance placed, or investment decision made, on the basis of such information by the recipient and (iv) does not undertake, and disclaims any duty to undertake, to update or to revise the information contained in this material.
Unless otherwise stated, the views, opinions, forecasts, valuations, or estimates contained in this material are those solely of the author, as of the date of publication of this material, and are subject to change without notice. The recipient of this material should make an independent evaluation of this information and make such other investigations as the recipient considers necessary (including obtaining independent financial advice), before transacting in any financial market or instrument discussed in or related to this material.
Important disclaimers for clients in the EU and UK
This publication has been prepared by Trading Desk Strategists within the Sales and Trading functions of Santander US Capital Markets LLC (“SanCap”), the US registered broker-dealer of Santander Corporate & Investment Banking. This communication is distributed in the EEA by Banco Santander S.A., a credit institution registered in Spain and authorised and regulated by the Bank of Spain and the CNMV. Any EEA recipient of this communication that would like to affect any transaction in any security or issuer discussed herein should do so with Banco Santander S.A. or any of its affiliates (together “Santander”). This communication has been distributed in the UK by Banco Santander, S.A.’s London branch, authorised by the Bank of Spain and subject to regulatory oversight on certain matters by the Financial Conduct Authority (FCA) and the Prudential Regulation Authority (PRA).
The publication is intended for exclusive use for Professional Clients and Eligible Counterparties as defined by MiFID II and is not intended for use by retail customers or for any persons or entities in any jurisdictions or country where such distribution or use would be contrary to local law or regulation.
This material is not a product of Santander´s Research Team and does not constitute independent investment research. This is a marketing communication and may contain ¨investment recommendations¨ as defined by the Market Abuse Regulation 596/2014 ("MAR"). This publication has not been prepared in accordance with legal requirements designed to promote the independence of research and is not subject to any prohibition on dealing ahead of the dissemination of investment research. The author, date and time of the production of this publication are as indicated herein.
This publication does not constitute investment advice and may not be relied upon to form an investment decision, nor should it be construed as any offer to sell or issue or invitation to purchase, acquire or subscribe for any instruments referred herein. The publication has been prepared in good faith and based on information Santander considers reliable as of the date of publication, but Santander does not guarantee or represent, express or implied, that such information is accurate or complete. All estimates, forecasts and opinions are current as at the date of this publication and are subject to change without notice. Unless otherwise indicated, Santander does not intend to update this publication. The views and commentary in this publication may not be objective or independent of the interests of the Trading and Sales functions of Santander, who may be active participants in the markets, investments or strategies referred to herein and/or may receive compensation from investment banking and non-investment banking services from entities mentioned herein. Santander may trade as principal, make a market or hold positions in instruments (or related derivatives) and/or hold financial interest in entities discussed herein. Santander may provide market commentary or trading strategies to other clients or engage in transactions which may differ from views expressed herein. Santander may have acted upon the contents of this publication prior to you having received it.
This publication is intended for the exclusive use of the recipient and must not be reproduced, redistributed or transmitted, in whole or in part, without Santander’s consent. The recipient agrees to keep confidential at all times information contained herein.


