


Uncategorized
Risk takers continued to outperform through November
admin | December 4, 2020
This document is intended for institutional investors and is not subject to all of the independence and disclosure standards applicable to debt research reports prepared for retail investors. This material does not constitute research.
More than half of CLO managers with five or more active deals outperformed the broad loan market from September through November. The average CLO leveraged loan portfolio gained 2.71% and after adjusting for broad market exposure, or beta, surpassed the market by 0.01%. Managers who held loan portfolios with wider spreads or lower bid depth at the end of August led the pack. Meanwhile, managers have seen their long-term track records improve from one year ago, despite challenges presented by the coronavirus pandemic.
Loan returns rose steadily since the start of September (Exhibit 1). Due to the positive coronavirus vaccine news, returns rose more noticeably in November than in October. The S&P/LSTA index has returned to its pre-coronavirus level. After accounting for the various reporting dates of managers, the index gained 2.6% over those three months. Managers held portfolios with an average beta of 1.04, which meant the average manager should have gained 2.7%. With the actual average performance at 2.71%, the average manager outperformed the index by 0.01%.
Exhibit 1: Loan returns increased through November
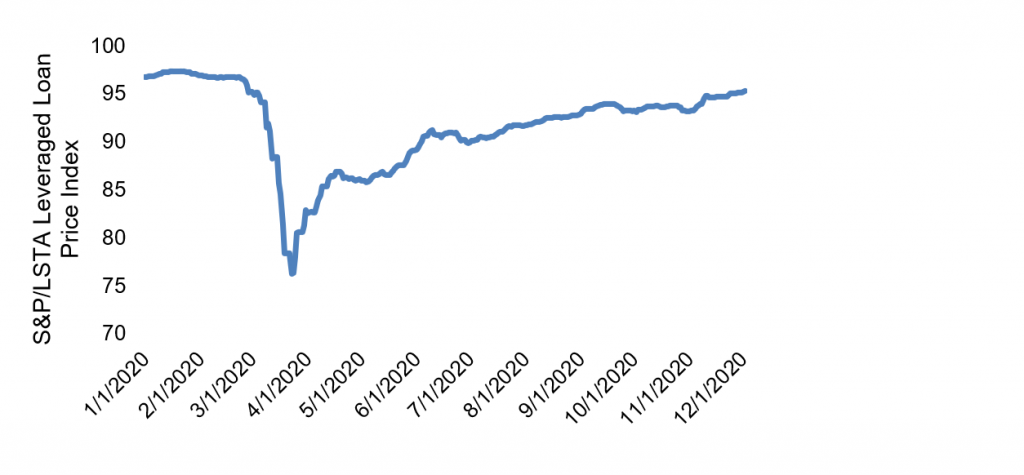
Source: Bloomberg, Amherst Pierpont Securities
About 56% of the managers outperformed the index, a mild drop from the figures reported by Amherst Pierpont last month (Exhibit 2). Out of the 66 managers, nine delivered alpha greater than 50 bp while three trailed the index by at least 50 bp.
Exhibit 2: More than half of the managers outperformed the index between September and November
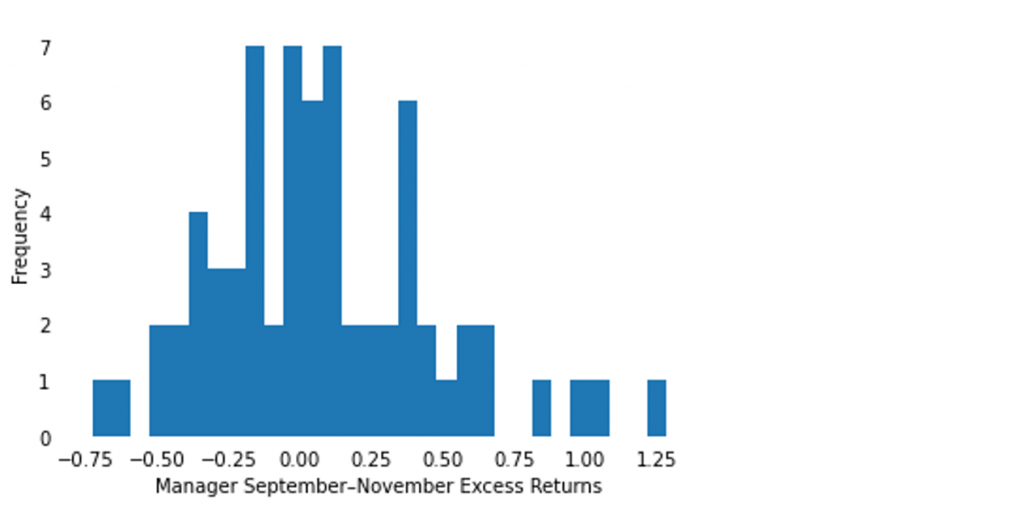
Note: data shows excess return only for active deals. Source: Amherst Pierpont Securities.
The weighted average spread and bid depth of the portfolio correlated most strongly with recent excess returns (Exhibit 3). Managers who held loans that have wider spreads or fewer bids on average delivered higher returns. Additionally, higher ‘Caa1’ exposure and weighted average rating factor correlated with more recent excess returns. These relationships indicate that managers holding riskier loans continued to outperform between September and November.
Exhibit 3: Correlation of portfolio or manager features with recent excess return
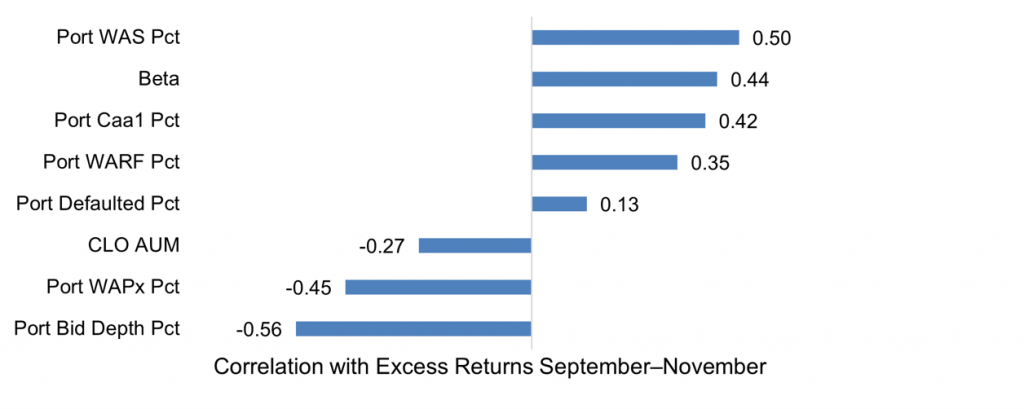
Note: data shows the correlation of manager or loan portfolio attribute with managers’ excess return or alpha from September through November only on active deals. Portfolio attributes measured as percentiles.
Source: Amherst Pierpont Securities.
Despite market challenges so far in 2020 from Covid-19, the long-term information ratios of managers have advanced since December 2019 (Exhibit 4). The most common long-term information ratios a year ago ranged between -0.1 and -0.04, while currently they range between 0 and 0.05. This improvement in the track records of managers speaks to their ability to add return to their portfolios amid the market turmoil this year.
Exhibit 4: The long-term track record of managers improved slightly during 2020
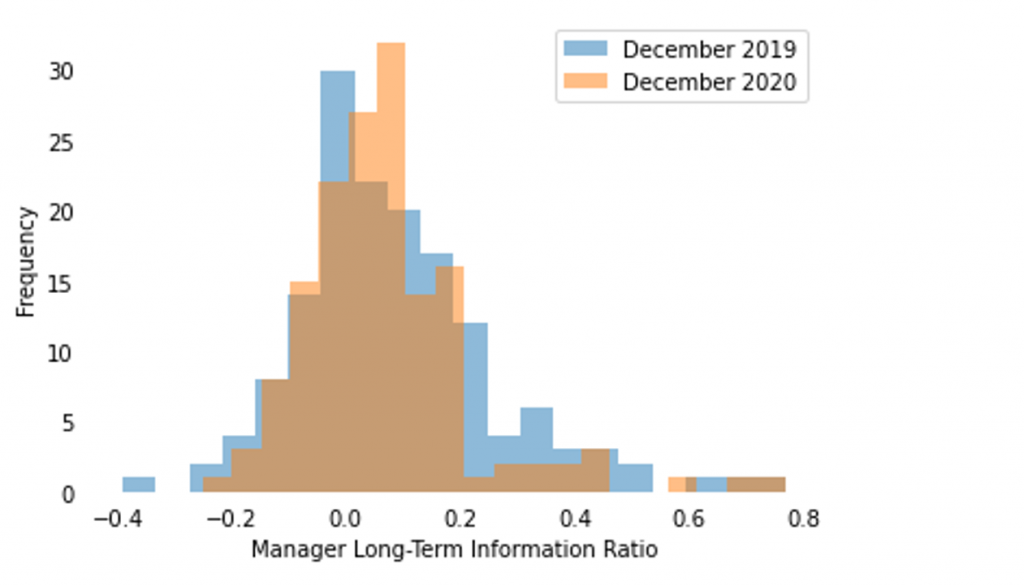
Note: Only managers with at least five active deals between September and November are included. Their long-term information ratios are captured at the start of December 2019 and December 2020, respectively.
Sources: Amherst Pierpont Securities
A total of 35 managers delivered positive alpha in the market between September and November (Exhibit 5). Jefferies, Angelo Gordon and ZAIS Group top the chart this time. The other Top 5 alpha leaders in this period include Marathon and DoubleLine.
Exhibit 5: Alpha leaders in CLO portfolio performance September-November 2020
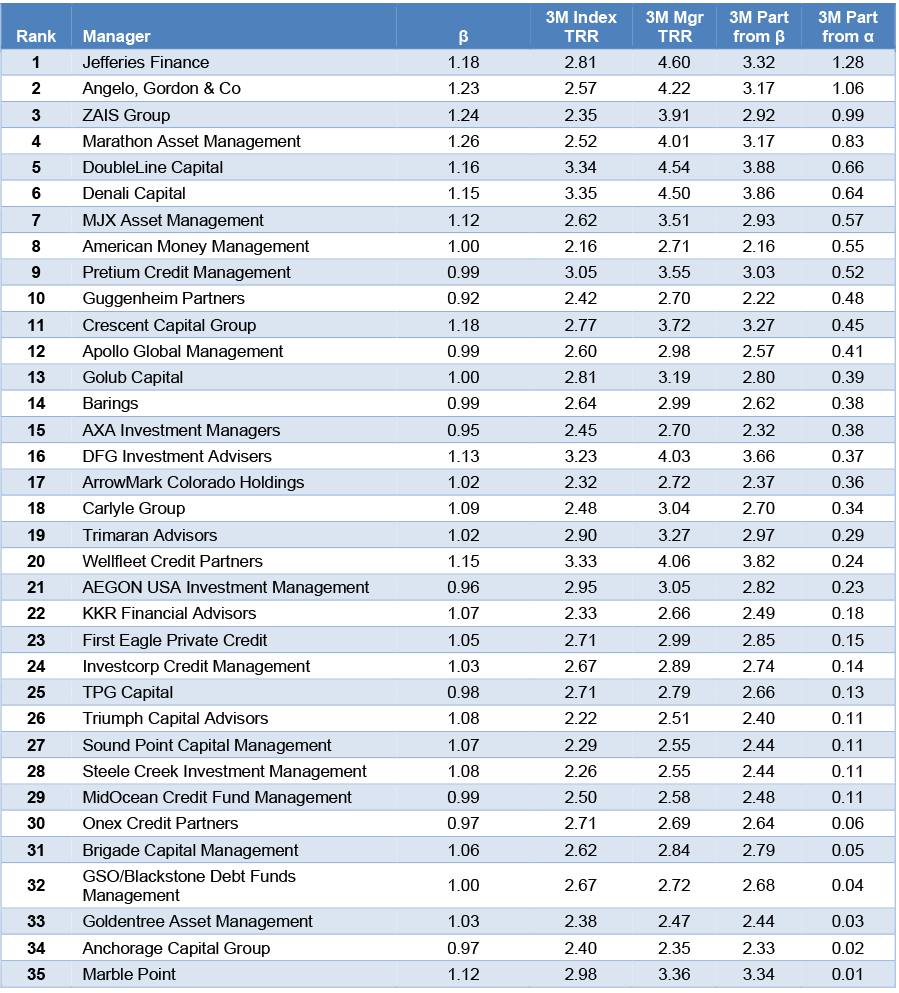
Note: Performance for managers with five or more deals tracked by APS. Performance attribution starts with calculated total return on the leveraged loan portfolio held in each CLO for the 3-month reporting period ending on the indicated date. CLOs, even with a single manager platform, may vary in reporting period. The analysis matches performance in each period to performance over the identical period in the S&P/LSTA Leveraged Loan Index. Where a deal has at least 18 months of performance history since pricing and no apparent errors in cash flow data, the analysis calculates a deal beta. The deal beta is multiplied by the index return to predict deal return attributable to broad market performance. Where no beta can be calculated, the analysis uses the average beta across each manager’s active deals weighted by the average deal principal balance over time. Any difference between performance attributable to beta and actual performance is attributed to manager alpha.
Source: Amherst Pierpont Securities.