


Uncategorized
Managing speeds and credit in 2021
admin | November 20, 2020
This document is intended for institutional investors and is not subject to all of the independence and disclosure standards applicable to debt research reports prepared for retail investors. This material does not constitute research.
Higher rates and a steeper curve should contribute to a prolonged slowdown in multifamily prepayments starting in 2021. Transition rates from forbearance to default should be higher than expected, with loss severities exacerbated by tumbling property prices in prime urban areas. This could take a toll on some FRESB tranches with heavy forbearance while other tranches in the same deal go relatively unscathed. Investment strategies shift towards some securities and structures that have been out of favor for the past year, while select project loan IOs continue to offer some of the best performance in volatile environments.
The transition out of forbearance
Unless the program is extended, the 6-month forbearance period for the vast majority of agency multifamily loans will expire by the end of 2020. Already there are signs that loans in forbearance are transitioning into delinquency and default at an accelerated pace. This has the largest impact on small balance loans, with over 11% of FRESB loans entering forbearance compared to only 2% of those in K-deals and about 1.7% of both Fannie Mae DUS and Ginnie Mae project loans.
There are 75 FRESB deals that have loans that were in forbearance at any time, though the percentage of the deal balance in forbearance varies widely, from a high of 28% to below 2%. Because loans are assigned to particular tranches of the deal based on their structure, some tranches in a deal often have no loans in forbearance while others can have 50% to 100% of the balance in forbearance (Exhibit 1).
Exhibit 1: FRESB loans in forbearance by deal and tranche
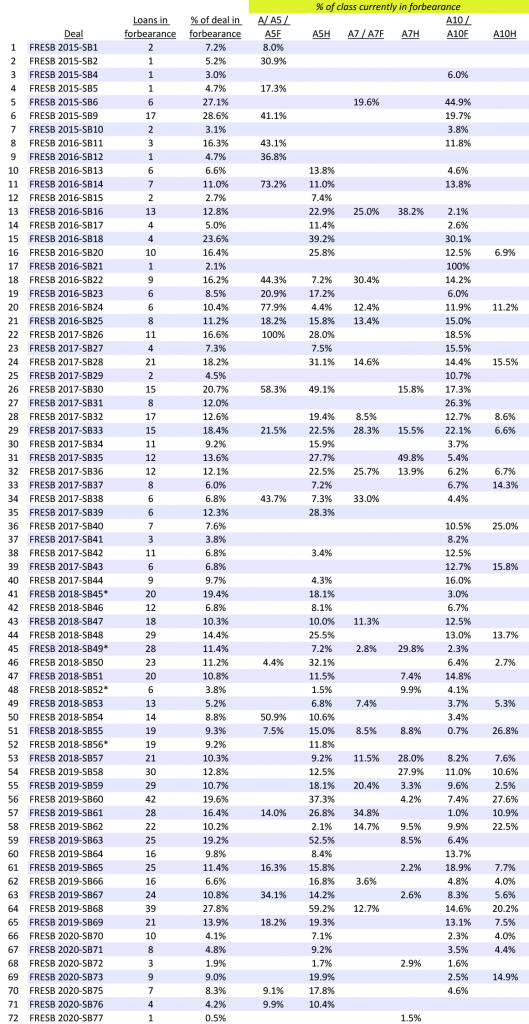
Note: Data as of 10/27/2020. Loans that were previously in forbearance but have since cured and are performing are not included. Loans that cured forbearance but whose payment status was late are included. The * deals have nonstandard structures and loan attribution to specific tranches could be misstated.
Source: Bloomberg, Amherst Pierpont Securities
Investors in securities with high levels of loans in forbearance are at increased risk of experiencing rapid prepayments in 2021 as up to 30% to 60% of these loans default and go into workout. Loss severities are likely to be higher than the 40% historical average due to the accumulated forbearance amounts that should increase losses.
Reversing strategy for slower prepayments
Prepayment speeds look set to shift from very fast to very slow if rates rise and stay there. The pandemic-driven low in rates would be tough to revisit. This should mean prepayments driven mostly by rate-related refinancing will be off the table. A downdraft in prices for multifamily properties should drag down cash-out refis, particularly for more recent vintages where properties have not had the benefit of several years of rising valuations to build equity.
High premium dollar price securities, which can underperform when prepayments and defaults are high, can outperform when prepayments are low and the bonds extend. Premium priced Ginnie Mae project loans, Ginnie Mae project loan IOs, and A1 classes of Freddie Mac K-series should all benefit from slower speeds.
The IOs are highly levered to a slowdown in prepayments since they absorb the premiums. The projected performance of the recently issued GNR 2020-132 IO shows the typical pattern (Exhibit 2). The lowest projected returns are at or close to the standard used for pricing at 15 CPJ, which is 15 CPR (15% prepayments per year) and 100 PLD (100% of the Ginnie Mae historical project loan default curve). Project loan IOs can have the “worst” performance at historical average prepay speeds over their lifetimes. However the bonds outperform when speeds are faster early in their lifetimes, in which case they collect prepayment premiums while the penalties are still high; and they can also outperform when prepayments are very slow and the bonds extend in maturity.
Exhibit 2: Projected performance of GNR 2020-132 IO
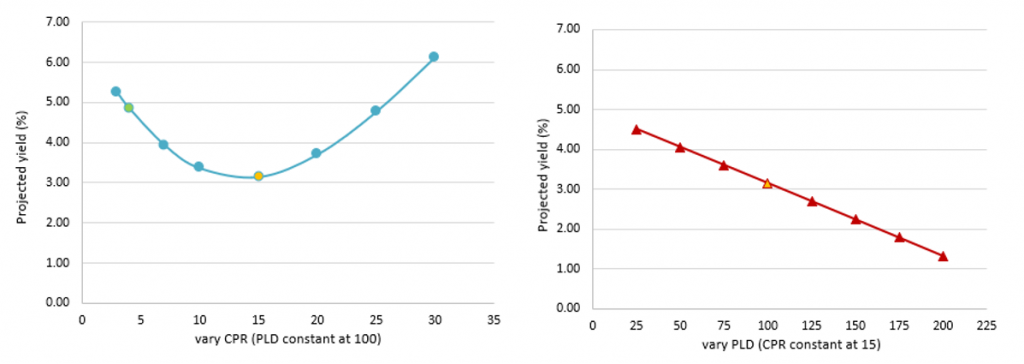
Note: Analysis as of 11-18-2020. All yield projections done on Bloomberg.
Source: Bloomberg, Amherst Pierpont Securities
The GNR 2020-132 IO was issued in September 2020 and has a projected yield of 3.34% at 15 CPJ. The recent back-up in rates has meant less than one-third of the pool has a 25 bp refinance incentive. Assuming rates rise and the curve steepens next year, those small rate refi incentives would evaporate, perhaps permanently. Current expectations are that the bond will prepay at a rate of 4 CPJ, increasing the projected yield to nearly 5.00%.
Seasoned project loan IOs can also benefit from the slowdown in prepayments. The GNR 2016-64 IB has recently collected high prepayment penalties thanks to a surge in speeds with 1-month CPR of 83 and 12-month CPR at 31 (Exhibit 3). The annualized return on the bond from issuance to 11/16/2020 is 4.00%, assuming a reinvestment rate of 3.00%.
Exhibit 3: GNR 2016-64 IB historical cashflows
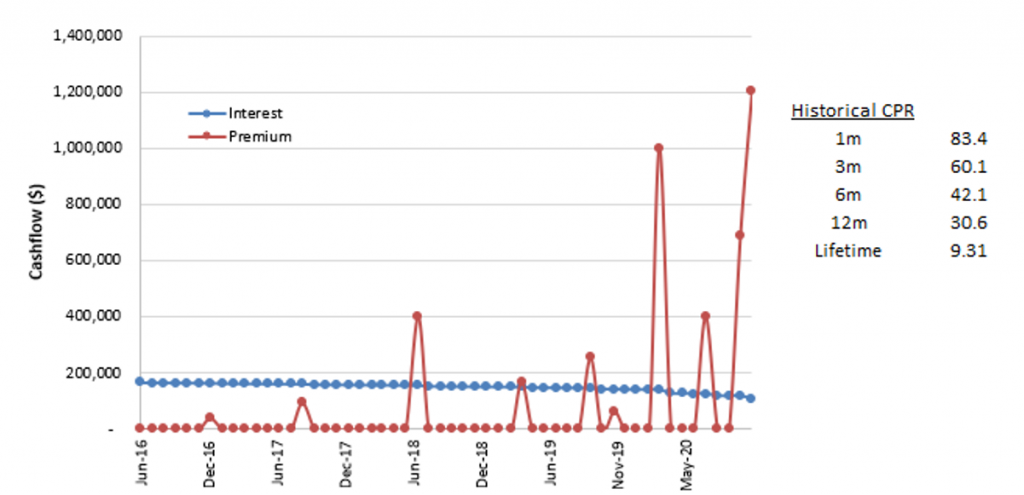
Note: Cashflows as of 11/16/2020. Source: Bloomberg, Amherst Pierpont Securities
The projected performance of these seasoned IOs is similar to that of the newer issues (Exhibit 4). The projected yield of the bond declines from 30 CPR to about 20 CPR, but then begins to rise again, and is higher than 4.00% at speeds below 15 CPR.
Exhibit 4: GNR 2016-64 IB projected performance
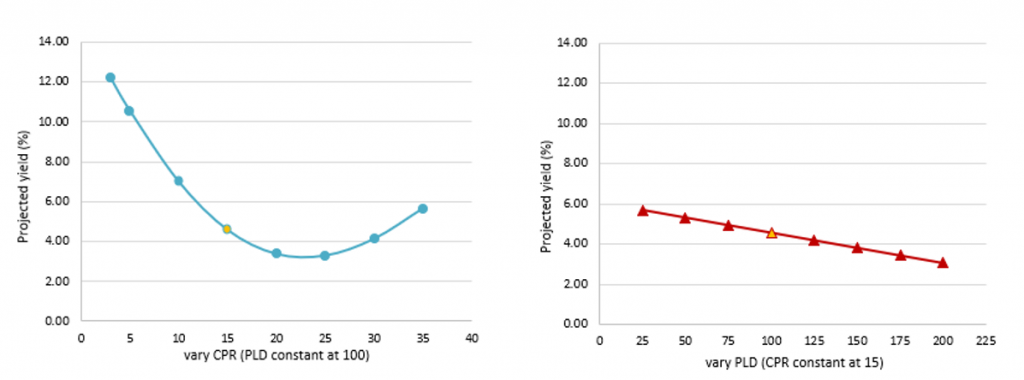
Note: Analysis as of 11/16/2020. Source: Bloomberg, Amherst Pierpont Securities
Short duration investors can pick up some incremental yield by being overweight A1 classes. The A1 classes of Freddie K-deals are the first to absorb prepayments during the open period of the underlying loans. High premium A1 classes can pick up several basis points of return when prepayments do not immediately occur at the start of the open period (Exhibit 5).
Exhibit 5: Impact of slower prepayments on A1 classes of Freddie K deals
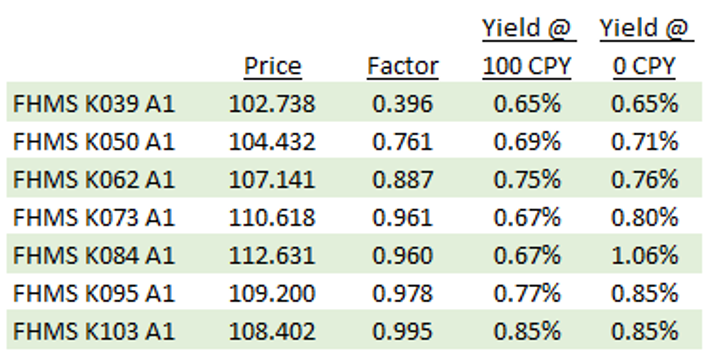
Source: Bloomberg, Amherst Pierpont Securities
The benefit of no diversification in Fannie Mae DUS
When investors need to avoid a broad risk from prepayments or forbearance, it helps to have securities backed by diversified pools of loans. But when investors want to avoid idiosyncratic risks, such as higher property price depreciation and potential defaults in prime metro areas over the next few years, it’s easier to do so by investing in single loan pools such as Fannie Mae DUS.
Poised for a correction in multifamily prices
Multifamily property prices declined 36.3% peak to trough during the housing crisis (Exhibit 6), mostly in-line with other commercial real estate sectors over the time period. Since hitting that trough in January 2010, multifamily price appreciation has significantly outpaced gains in all other segments.
Exhibit 6: US commercial real estate price indices by property type
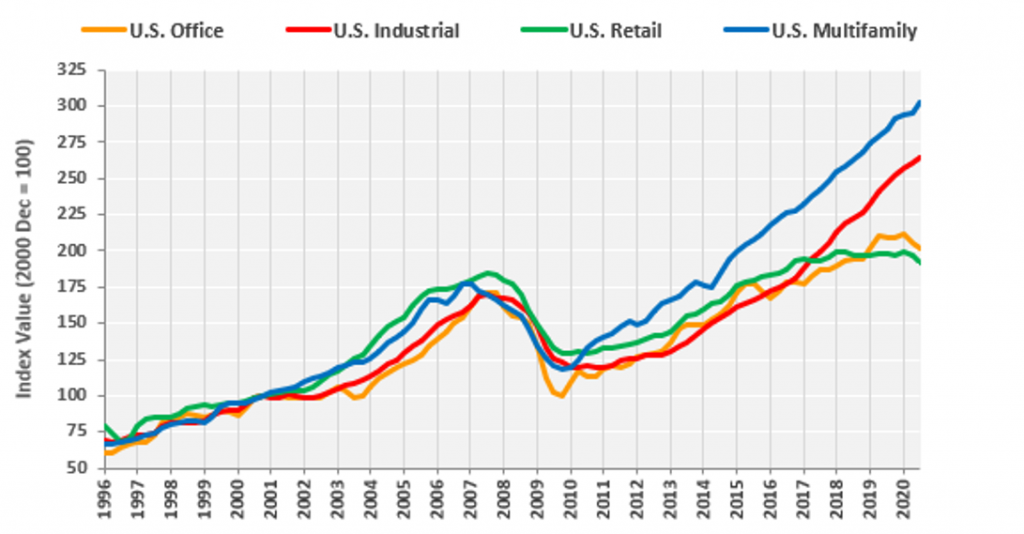
Note: Commercial repeat-sale indices, value-weighted, quarterly data through Sept 2020.
Source: CoStar
Much of the outperformance has been driven by rising property prices in dense urban areas, which are now experiencing flight due to the pandemic. A second driver has been a long-term shortage of moderate- and low-income multifamily housing, which has driven up rents and property values.
The urban-suburban divide
Breaking down the broad multifamily index shows that prices in prime metro areas were down 7.7% in the third quarter of 2020 from the pre-pandemic high in the fourth quarter of 2019 (Exhibit 7). The prime multifamily markets are dominated by large, core, coastal metros including New York, Los Angeles, Orange County, San Francisco, Seattle, Houston, Washington D.C. and Chicago. These areas have experienced significant runup in pricing during the current cycle. The broad multifamily index is 2.9% higher than its pre-pandemic level in the fourth quarter of 2019. Urban multifamily property prices in gateway cities have come under the most stress, while suburban prices have so far remained stable or continue to climb.
Exhibit 7: US multifamily broad market and prime metros indices

Note: Commercial repeat-sale indices, equal-weighted, quarterly data through Sept 2020.
Source: CoStar
Despite the apparent health of the broad market there is a dearth of sales. Commercial real estate transaction volume is down 40% year-to-date from 2019 levels. So far, there has also been no uptick in distressed sales, which remain at 1.7% of the overall market and on par with the average of the previous few years.
Although one or more vaccines will begin to return much of life to normal in 2021, the success of work-from-home has created exceptional flexibility. Corporations now have the opportunity to downsize their expensive office footprints, and employees who are reluctant to return to long commutes in cramped and high-priced urban cores can negotiate for more remote work. Distressed sales have been delayed by forbearance, but they are on the way. Multifamily forbearance programs have already started to expire, and the vast majority of agency multifamily loans will need to begin repayment by the end of 2020. Even if the programs are extended, occupancy rates and rents are likely to be depressed for several years in urban areas, making it more difficult for borrowers to make regular loan payments and cover forborne amounts. The eventual wave of distressed sales could cause multifamily prices in prime metros to drop significantly from their pre-pandemic peak. Careful selection of Fannie Mae DUS pools should allow investors to avoid or mitigate these risks while building a portfolio of suburban properties likely to thrive over the coming years.