Uncategorized
The pandemic impact on employment
admin | November 13, 2020
This material is a Marketing Communication and does not constitute Independent Investment Research.
The economy has made a remarkable comeback after the spring Covid lockdowns as GDP has surged and key indicators of spending like retail sales and core capital goods orders and shipments have exceeded pre-pandemic levels. The labor market has also rebounded faster than most economists anticipated in the spring but nevertheless has lagged the bounce in GDP and spending. Payrolls have reversed just over half of the March-April losses. A breakdown by sector shows the lag in jobs is, not surprisingly, correlated with how directly the pandemic has affected each industry.
Defining categories
It seems useful to separate the economy into three categories, starting with industries that are not suffering from ongoing direct pandemic effects. These industries may still be well below pre-pandemic employment levels due to soft demand or other factors unrelated to the pandemic, but there is nothing about the virus that is directly depressing the sector. Mining is one example. There is no question that oil prices fell sharply due to the Covid lockdowns, which in turn curtailed domestic drilling, so mining employment has remain depressed and in fact is lower now than in April, but these are indirect effects. A number of other industries could make similar claims to a continuing Covid effect, but I want to focus purely on sectors where social distancing and government restrictions are exerting an ongoing and direct drag on activity. This category will include most sectors.
The second category includes industries where the virus is having an ongoing impact, but businesses have found a way to substantially resume operations. The clearest example here would be restaurants, where firms have resumed operations as best they can but are being directly restricted from going further by the virus. I have also included education in this group, as schools are partially reopened around the country but far from back to normal. Other categories that belong here include the TV and motion picture industry, which appears to have just returned to action over the last month or two, temp agencies, services to buildings and dwellings, which includes janitors and security for office buildings, social assistance, which includes day care centers, and “other services,” which includes personal services like hair and nail salons.
The final category includes industries still substantially depressed as a direct result of the pandemic. Air travel, transit, arts, entertainment, and recreation, which includes spectator events, amusement parks, and casinos, and hotels all belong here. One might make a case for any number of industries to be included here, but the dividing lines between categories are entirely subjective and not entirely obvious.
Payroll swings by category
Category I included almost 89 million workers in February, lost about 6.5 million jobs during the lockdowns, and has since restored about 3.5 million jobs.
Except for the TV and movie industry and education sectors, the degree of recovery in Category II industries has been remarkably similar, in the 60% to 70% range, with retail trade doing somewhat better (Exhibit 1).
Exhibit 1: Employment in “Category 2” Industries
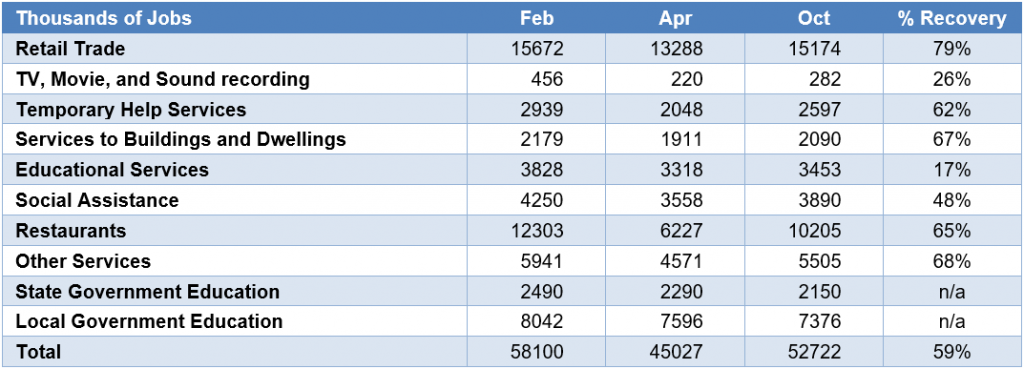
Source: BLS.
The air travel industry continues to shed jobs, while the other three industries in Category III have regained about one third of the jobs lost during the lockdowns (Exhibit 2).
Exhibit 2: Employment in “Category 3” Industries
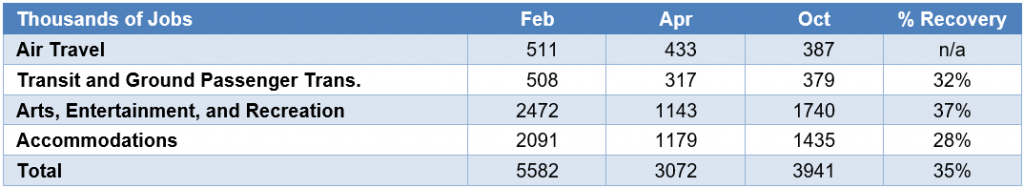
Source: BLS.
Digging out of a hole
Perhaps counterintuitively, the Category II sectors have recovered a higher percentage of the jobs lost during the lockdowns, 59%, than the Category I sectors, which have only restored 53% of the jobs lost in March and April. However, this puzzle can be easily explained. The Category I sectors only shed about 7.5% of their February payrolls in March and April, while the Category II sectors dropped three times that percentage and Category III industries’ payrolls fell by nearly half.
What these numbers suggest is that there are really two broad forces that can help to restore employment back to pre-pandemic levels. For Category I, the three million jobs drop from February to October is mainly explained by a lower level of activity broadly. The example of the mining industry is illuminating. Oil prices bounced noticeably when the Pfizer/BioNTech vaccine news hit on November 9. As the economy is able to return to health, which of course is dependent on the course of the virus, one might expect, all else equal, oil prices to rise and thus drilling activity to revive. As the level of economic activity lifts, the Category I jobs should gradually be restored. Individual sectors may be stronger, such as warehouse and delivery for online retail, while others may be permanently weakened from the pre-Covid state of the world, such as commercial construction, but the broad level of activity and in turn employment should recover.
For many of the sectors in Categories II and III, however, the recovery may be more non-linear. There will come a day when social distancing restrictions will be mostly lifted, and I would expect activity in the affected sectors to respond accordingly. Restaurants will, at some point, be allowed to return to full capacity indoor dining. Day care centers and schools will eventually return to normal operation, perhaps at the beginning of the 2021-22 academic year. Travel will resume, though it may look different than before.
Quantifying the remaining ground to make up
Overall, payrolls dropped by over 22 million in March and April and have since recovered 12 million. That leaves the U.S. economy still in a 10 million job hole. It is interesting to focus on where those jobs are. Three million of them are in Category I, including 600,000 manufacturing jobs, 300,000 construction jobs, and over a million professional services positions. Meanwhile, Category II sectors are still running more than five million below the February level, with restaurants representing two million of that and education, private and public, accounting for another 1.4 million. The Category III industries, which represent a small portion of overall jobs, still account for over 1.5 million of the jobs still missing relative to February.
Based on this analysis, the most likely scenario is that payrolls continue to gradually rise over the next few months, with the pace of improvement contingent to a degree on the course of the virus, the surge in cases likely impeding job growth in November and December. Unfortunately, monthly increases of 600,000 or 700,000, as we have seen in recent months, while roughly triple a normal rise, will not help to dig out of that 10 million job hole very quickly. However, at some point in 2021, once a vaccine has been widely distributed and the incidence of Covid wanes, we may see a flurry of hiring, as social distancing restrictions are relaxed and schools, restaurants, and other businesses can return to more normal operations.
This material is intended only for institutional investors and does not carry all of the independence and disclosure standards of retail debt research reports. In the preparation of this material, the author may have consulted or otherwise discussed the matters referenced herein with one or more of SCM’s trading desks, any of which may have accumulated or otherwise taken a position, long or short, in any of the financial instruments discussed in or related to this material. Further, SCM may act as a market maker or principal dealer and may have proprietary interests that differ or conflict with the recipient hereof, in connection with any financial instrument discussed in or related to this material.
This message, including any attachments or links contained herein, is subject to important disclaimers, conditions, and disclosures regarding Electronic Communications, which you can find at https://portfolio-strategy.apsec.com/sancap-disclaimers-and-disclosures.
Important Disclaimers
Copyright © 2026 Santander US Capital Markets LLC and its affiliates (“SCM”). All rights reserved. SCM is a member of FINRA and SIPC. This material is intended for limited distribution to institutions only and is not publicly available. Any unauthorized use or disclosure is prohibited.
In making this material available, SCM (i) is not providing any advice to the recipient, including, without limitation, any advice as to investment, legal, accounting, tax and financial matters, (ii) is not acting as an advisor or fiduciary in respect of the recipient, (iii) is not making any predictions or projections and (iv) intends that any recipient to which SCM has provided this material is an “institutional investor” (as defined under applicable law and regulation, including FINRA Rule 4512 and that this material will not be disseminated, in whole or part, to any third party by the recipient.
The author of this material is an economist, desk strategist or trader. In the preparation of this material, the author may have consulted or otherwise discussed the matters referenced herein with one or more of SCM’s trading desks, any of which may have accumulated or otherwise taken a position, long or short, in any of the financial instruments discussed in or related to this material. Further, SCM or any of its affiliates may act as a market maker or principal dealer and may have proprietary interests that differ or conflict with the recipient hereof, in connection with any financial instrument discussed in or related to this material.
This material (i) has been prepared for information purposes only and does not constitute a solicitation or an offer to buy or sell any securities, related investments or other financial instruments, (ii) is neither research, a “research report” as commonly understood under the securities laws and regulations promulgated thereunder nor the product of a research department, (iii) or parts thereof may have been obtained from various sources, the reliability of which has not been verified and cannot be guaranteed by SCM, (iv) should not be reproduced or disclosed to any other person, without SCM’s prior consent and (v) is not intended for distribution in any jurisdiction in which its distribution would be prohibited.
In connection with this material, SCM (i) makes no representation or warranties as to the appropriateness or reliance for use in any transaction or as to the permissibility or legality of any financial instrument in any jurisdiction, (ii) believes the information in this material to be reliable, has not independently verified such information and makes no representation, express or implied, with regard to the accuracy or completeness of such information, (iii) accepts no responsibility or liability as to any reliance placed, or investment decision made, on the basis of such information by the recipient and (iv) does not undertake, and disclaims any duty to undertake, to update or to revise the information contained in this material.
Unless otherwise stated, the views, opinions, forecasts, valuations, or estimates contained in this material are those solely of the author, as of the date of publication of this material, and are subject to change without notice. The recipient of this material should make an independent evaluation of this information and make such other investigations as the recipient considers necessary (including obtaining independent financial advice), before transacting in any financial market or instrument discussed in or related to this material.
Important disclaimers for clients in the EU and UK
This publication has been prepared by Trading Desk Strategists within the Sales and Trading functions of Santander US Capital Markets LLC (“SanCap”), the US registered broker-dealer of Santander Corporate & Investment Banking. This communication is distributed in the EEA by Banco Santander S.A., a credit institution registered in Spain and authorised and regulated by the Bank of Spain and the CNMV. Any EEA recipient of this communication that would like to affect any transaction in any security or issuer discussed herein should do so with Banco Santander S.A. or any of its affiliates (together “Santander”). This communication has been distributed in the UK by Banco Santander, S.A.’s London branch, authorised by the Bank of Spain and subject to regulatory oversight on certain matters by the Financial Conduct Authority (FCA) and the Prudential Regulation Authority (PRA).
The publication is intended for exclusive use for Professional Clients and Eligible Counterparties as defined by MiFID II and is not intended for use by retail customers or for any persons or entities in any jurisdictions or country where such distribution or use would be contrary to local law or regulation.
This material is not a product of Santander´s Research Team and does not constitute independent investment research. This is a marketing communication and may contain ¨investment recommendations¨ as defined by the Market Abuse Regulation 596/2014 ("MAR"). This publication has not been prepared in accordance with legal requirements designed to promote the independence of research and is not subject to any prohibition on dealing ahead of the dissemination of investment research. The author, date and time of the production of this publication are as indicated herein.
This publication does not constitute investment advice and may not be relied upon to form an investment decision, nor should it be construed as any offer to sell or issue or invitation to purchase, acquire or subscribe for any instruments referred herein. The publication has been prepared in good faith and based on information Santander considers reliable as of the date of publication, but Santander does not guarantee or represent, express or implied, that such information is accurate or complete. All estimates, forecasts and opinions are current as at the date of this publication and are subject to change without notice. Unless otherwise indicated, Santander does not intend to update this publication. The views and commentary in this publication may not be objective or independent of the interests of the Trading and Sales functions of Santander, who may be active participants in the markets, investments or strategies referred to herein and/or may receive compensation from investment banking and non-investment banking services from entities mentioned herein. Santander may trade as principal, make a market or hold positions in instruments (or related derivatives) and/or hold financial interest in entities discussed herein. Santander may provide market commentary or trading strategies to other clients or engage in transactions which may differ from views expressed herein. Santander may have acted upon the contents of this publication prior to you having received it.
This publication is intended for the exclusive use of the recipient and must not be reproduced, redistributed or transmitted, in whole or in part, without Santander’s consent. The recipient agrees to keep confidential at all times information contained herein.


