Uncategorized
Credit spreads tightened as Treasuries sold off in October
admin | November 6, 2020
This material is a Marketing Communication and does not constitute Independent Investment Research.
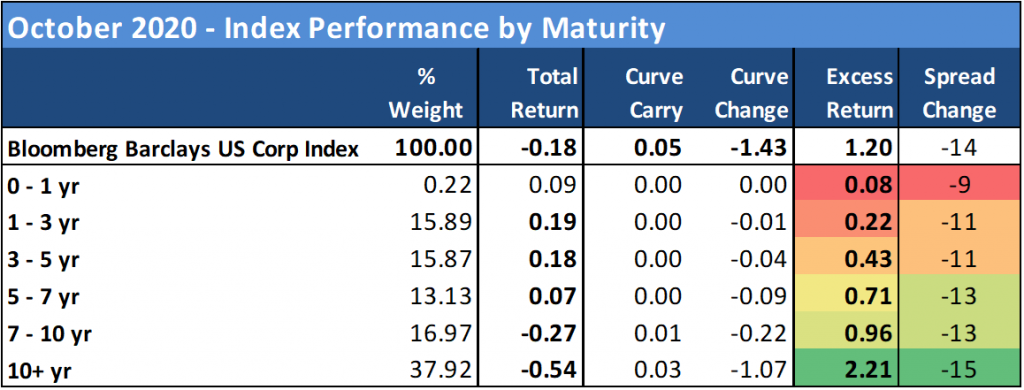
The investment grade corporate bond index recovered nicely from the modest sell-off in September, generating a positive excess return of 1.20% as aggregate OAS tightened by 14 bp in October. The sell-off in US Treasuries throughout the month outweighed the credit rally, resulting in a -0.18% total return for the index. There are no changes to our sector recommendations for November.
Exhibit 1. APS Sector Recommendations for November 2020
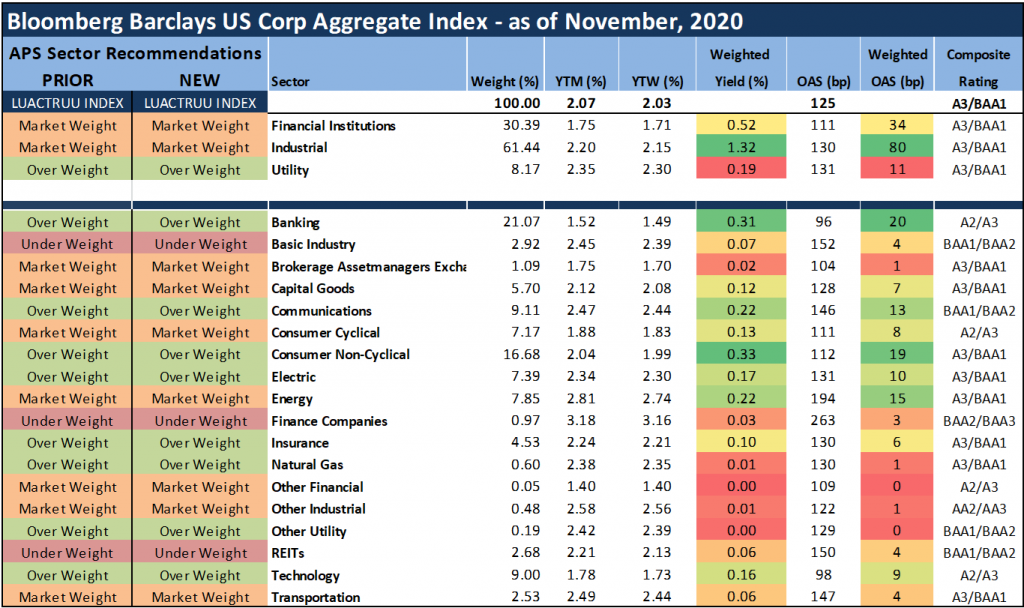
Note: The table provides a summary of how APS expects sectors within the IG Index to perform for the next several months, on an excess return basis (total return net of commensurate UST return). These weightings serve as a proxy for how portfolio managers should position their holdings relative to the broad IG corporate bond market.
Source: Bloomberg/Barclays US Corp Index, Amherst Pierpont Securities
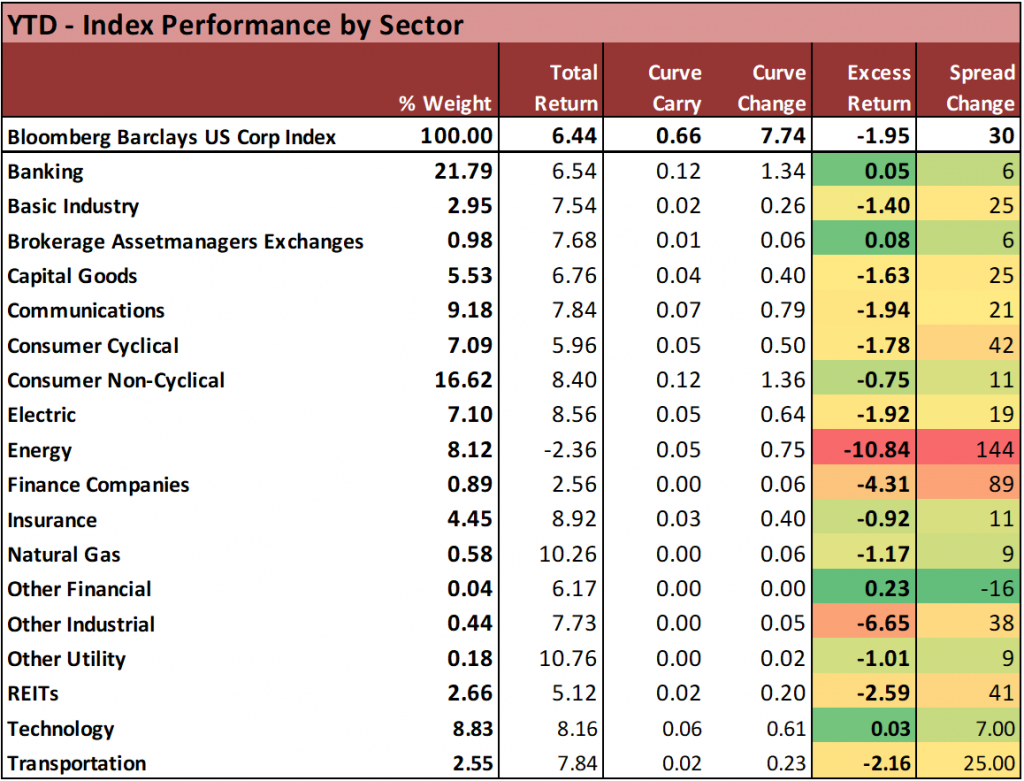
For a third consecutive month, finance companies (+2.14% excess return) provided the single best performance in the IG Index, aided by the surprisingly optimistic results and outlook posted by General Electric (GE) for the third quarter of 2020, which caused a quick rally in spreads. The sector also benefited from a continued relief rally among aircraft lessors, despite the fact that the recent Covid-related setbacks, both domestically and abroad, serve to threaten the recovery in airline travel. Also among the top 5 sector performances were insurance (+1.81%), natural gas (+1.80%), basic industry (+1.72) and utilities (+1.41%). The late-month selloff in global oil prices was apparent in corporate trading as energy (+0.78%) lagged most of the entire index for a second consecutive month. Other bottom performers included REITs (+0.94%), technology (+0.96%), and banking (+0.99%), while most other segments were all closely in-line with the aggregate index performance.
The IG new issue calendar narrowly topped consensus expectations for October, delivering just over $95 billion in total volume for the month. This represented a modest gain over the prior year period ($89 billion), and a seasonal step down from the triple-digit volumes over the prior two months. High yield added just under $40 billion in additional issuance, a nearly 60% increase over October of 2019, and enough to boost total corporate USD issuance by 20% year-over-year. Activity tapered off demonstrably in the later sessions of the month, as issuers await clarity on the election results. Still, expectations are tempered for November, as the $70-75 billion estimates seem to be on the high side given not only seasonal and holiday related weakness, but also the uncertainty of the election outcome potentially keeping issuers sidelined for longer than expected.
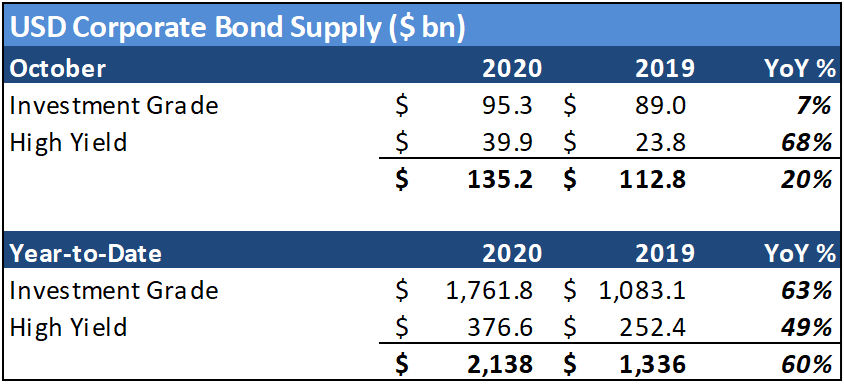
Source: Bloomberg LP
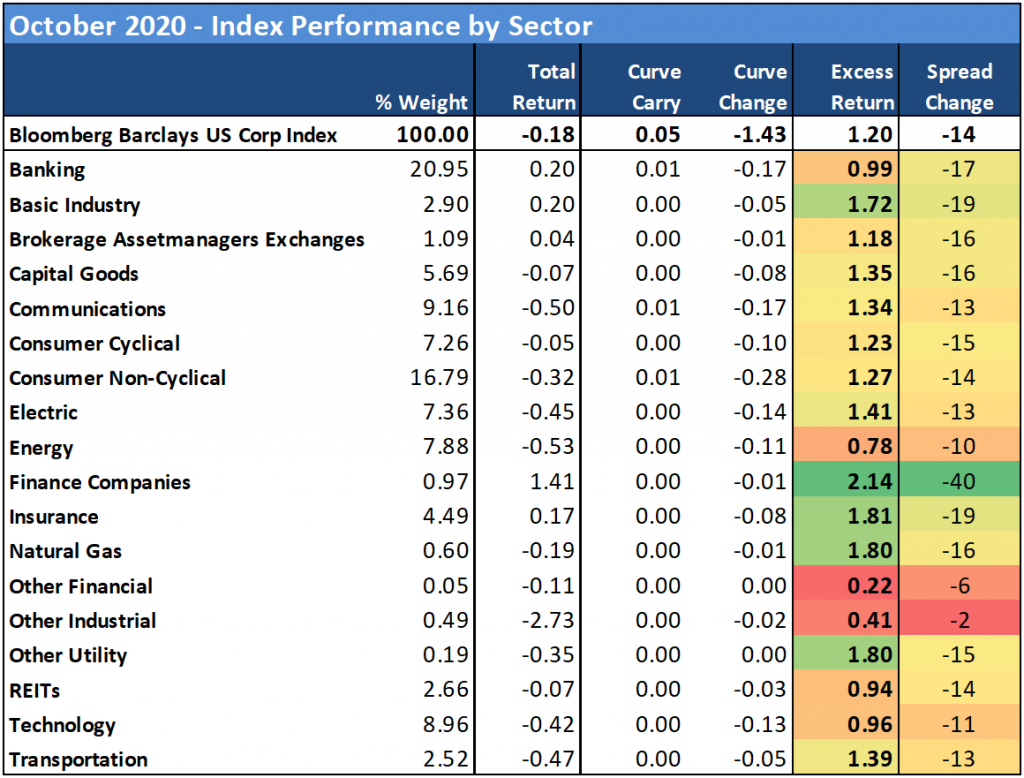
Source: Bloomberg Barclays US Corp Index
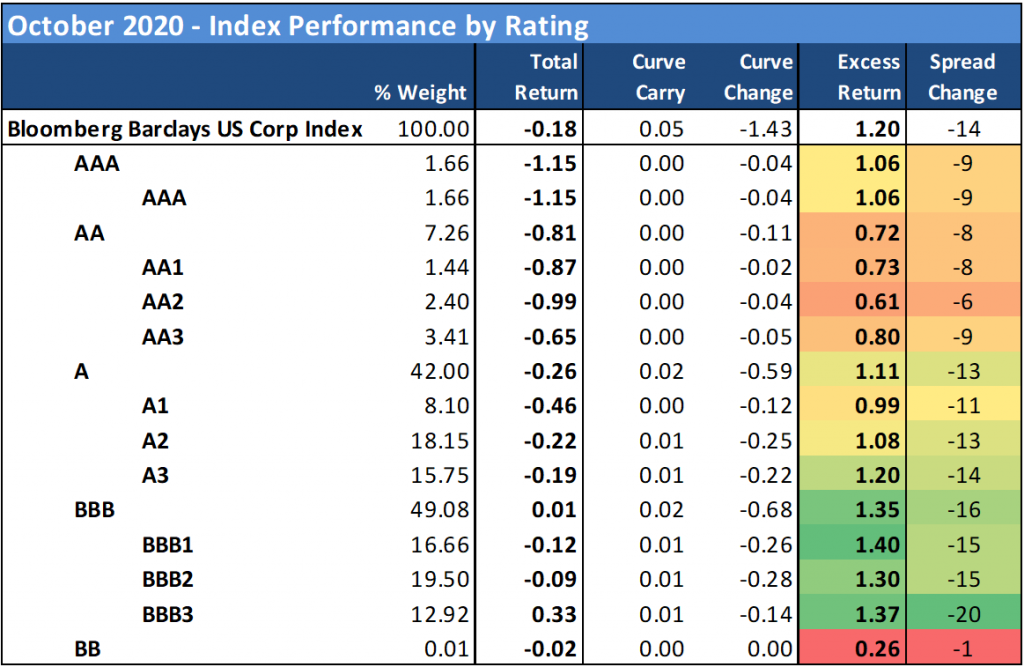
Source: Bloomberg Barclays US Corp Index
Source: Bloomberg Barclays US Corp Index
Source: Bloomberg Barclays US Corp Index
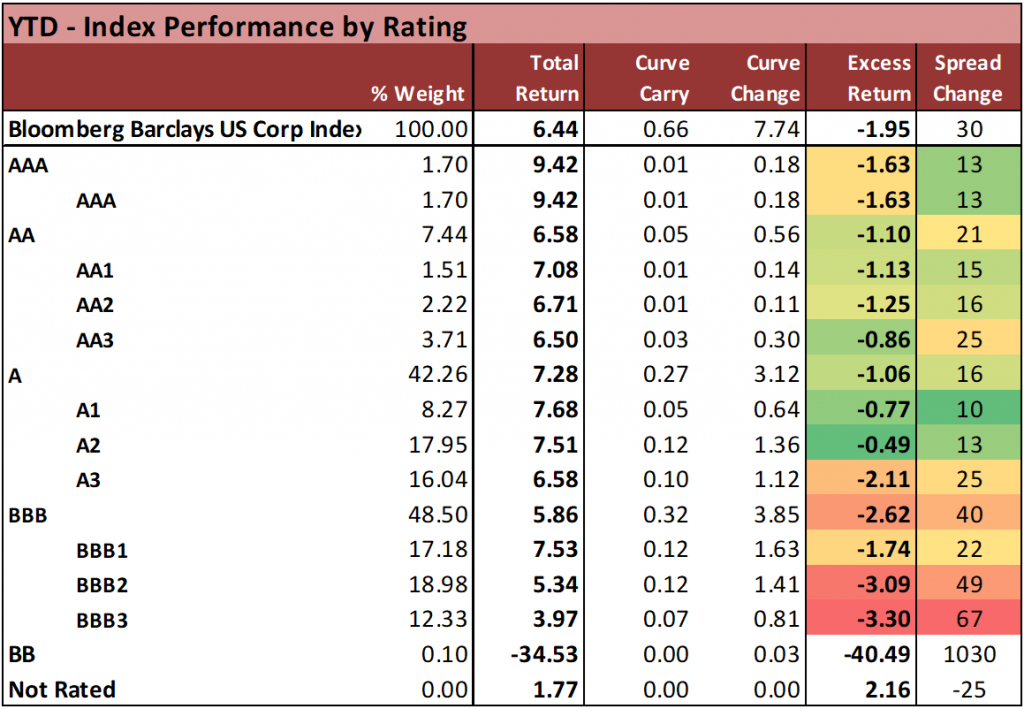
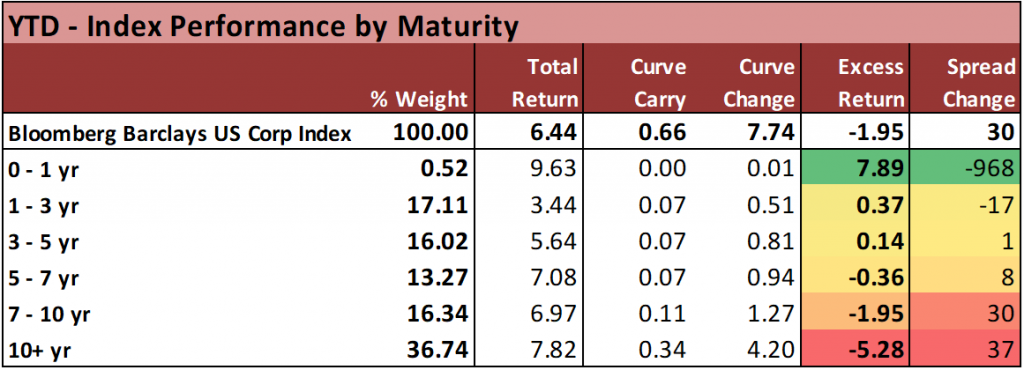
IG Corporate Bond Index – Year-to-Date Return Attribution Summary
Source: Bloomberg Barclays US Corp Index
Source: Bloomberg Barclays US Corp Index
Source: Bloomberg Barclays US Corp Index
This material is intended only for institutional investors and does not carry all of the independence and disclosure standards of retail debt research reports. In the preparation of this material, the author may have consulted or otherwise discussed the matters referenced herein with one or more of SCM’s trading desks, any of which may have accumulated or otherwise taken a position, long or short, in any of the financial instruments discussed in or related to this material. Further, SCM may act as a market maker or principal dealer and may have proprietary interests that differ or conflict with the recipient hereof, in connection with any financial instrument discussed in or related to this material.
This message, including any attachments or links contained herein, is subject to important disclaimers, conditions, and disclosures regarding Electronic Communications, which you can find at https://portfolio-strategy.apsec.com/sancap-disclaimers-and-disclosures.
Important Disclaimers
Copyright © 2026 Santander US Capital Markets LLC and its affiliates (“SCM”). All rights reserved. SCM is a member of FINRA and SIPC. This material is intended for limited distribution to institutions only and is not publicly available. Any unauthorized use or disclosure is prohibited.
In making this material available, SCM (i) is not providing any advice to the recipient, including, without limitation, any advice as to investment, legal, accounting, tax and financial matters, (ii) is not acting as an advisor or fiduciary in respect of the recipient, (iii) is not making any predictions or projections and (iv) intends that any recipient to which SCM has provided this material is an “institutional investor” (as defined under applicable law and regulation, including FINRA Rule 4512 and that this material will not be disseminated, in whole or part, to any third party by the recipient.
The author of this material is an economist, desk strategist or trader. In the preparation of this material, the author may have consulted or otherwise discussed the matters referenced herein with one or more of SCM’s trading desks, any of which may have accumulated or otherwise taken a position, long or short, in any of the financial instruments discussed in or related to this material. Further, SCM or any of its affiliates may act as a market maker or principal dealer and may have proprietary interests that differ or conflict with the recipient hereof, in connection with any financial instrument discussed in or related to this material.
This material (i) has been prepared for information purposes only and does not constitute a solicitation or an offer to buy or sell any securities, related investments or other financial instruments, (ii) is neither research, a “research report” as commonly understood under the securities laws and regulations promulgated thereunder nor the product of a research department, (iii) or parts thereof may have been obtained from various sources, the reliability of which has not been verified and cannot be guaranteed by SCM, (iv) should not be reproduced or disclosed to any other person, without SCM’s prior consent and (v) is not intended for distribution in any jurisdiction in which its distribution would be prohibited.
In connection with this material, SCM (i) makes no representation or warranties as to the appropriateness or reliance for use in any transaction or as to the permissibility or legality of any financial instrument in any jurisdiction, (ii) believes the information in this material to be reliable, has not independently verified such information and makes no representation, express or implied, with regard to the accuracy or completeness of such information, (iii) accepts no responsibility or liability as to any reliance placed, or investment decision made, on the basis of such information by the recipient and (iv) does not undertake, and disclaims any duty to undertake, to update or to revise the information contained in this material.
Unless otherwise stated, the views, opinions, forecasts, valuations, or estimates contained in this material are those solely of the author, as of the date of publication of this material, and are subject to change without notice. The recipient of this material should make an independent evaluation of this information and make such other investigations as the recipient considers necessary (including obtaining independent financial advice), before transacting in any financial market or instrument discussed in or related to this material.
Important disclaimers for clients in the EU and UK
This publication has been prepared by Trading Desk Strategists within the Sales and Trading functions of Santander US Capital Markets LLC (“SanCap”), the US registered broker-dealer of Santander Corporate & Investment Banking. This communication is distributed in the EEA by Banco Santander S.A., a credit institution registered in Spain and authorised and regulated by the Bank of Spain and the CNMV. Any EEA recipient of this communication that would like to affect any transaction in any security or issuer discussed herein should do so with Banco Santander S.A. or any of its affiliates (together “Santander”). This communication has been distributed in the UK by Banco Santander, S.A.’s London branch, authorised by the Bank of Spain and subject to regulatory oversight on certain matters by the Financial Conduct Authority (FCA) and the Prudential Regulation Authority (PRA).
The publication is intended for exclusive use for Professional Clients and Eligible Counterparties as defined by MiFID II and is not intended for use by retail customers or for any persons or entities in any jurisdictions or country where such distribution or use would be contrary to local law or regulation.
This material is not a product of Santander´s Research Team and does not constitute independent investment research. This is a marketing communication and may contain ¨investment recommendations¨ as defined by the Market Abuse Regulation 596/2014 ("MAR"). This publication has not been prepared in accordance with legal requirements designed to promote the independence of research and is not subject to any prohibition on dealing ahead of the dissemination of investment research. The author, date and time of the production of this publication are as indicated herein.
This publication does not constitute investment advice and may not be relied upon to form an investment decision, nor should it be construed as any offer to sell or issue or invitation to purchase, acquire or subscribe for any instruments referred herein. The publication has been prepared in good faith and based on information Santander considers reliable as of the date of publication, but Santander does not guarantee or represent, express or implied, that such information is accurate or complete. All estimates, forecasts and opinions are current as at the date of this publication and are subject to change without notice. Unless otherwise indicated, Santander does not intend to update this publication. The views and commentary in this publication may not be objective or independent of the interests of the Trading and Sales functions of Santander, who may be active participants in the markets, investments or strategies referred to herein and/or may receive compensation from investment banking and non-investment banking services from entities mentioned herein. Santander may trade as principal, make a market or hold positions in instruments (or related derivatives) and/or hold financial interest in entities discussed herein. Santander may provide market commentary or trading strategies to other clients or engage in transactions which may differ from views expressed herein. Santander may have acted upon the contents of this publication prior to you having received it.
This publication is intended for the exclusive use of the recipient and must not be reproduced, redistributed or transmitted, in whole or in part, without Santander’s consent. The recipient agrees to keep confidential at all times information contained herein.


