Uncategorized
Payment velocity picks up in prime and non-QM
admin | October 30, 2020
This material is a Marketing Communication and does not constitute Independent Investment Research.
As the mortgage credit markets move further away from the early stages of the pandemic and the associated deterioration in borrower performance, investors are looking for initial signs that borrowers exiting forbearance plans have resumed making payments. And while there are signs of improving borrower performance across all sectors, post-crisis prime and non-QM borrowers appear to be recovering faster than others.
Given the unprecedented impact of the pandemic on borrowers, the market does not have a firm grasp on how they will perform over the next several months as forbearance plans end. Broad-based, robust housing fundamentals coupled with significant amounts of borrower equity suggest the majority of borrowers will begin to re-perform in the coming months, and early signs of that have already begun to appear in the post-crisis prime and non-QM sectors of the market,
Tracking transition rates across mortgage credit
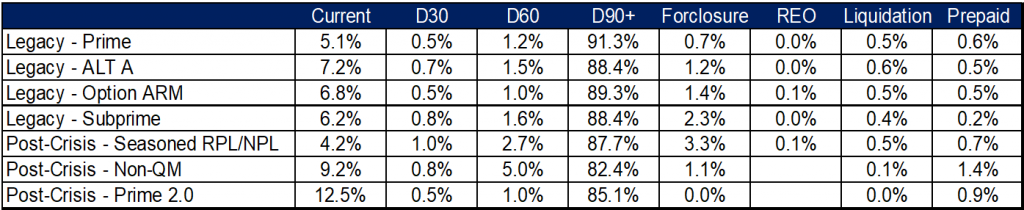
One useful metric of borrower performance is month-over-month change in delinquency status across loans. This becomes a bit of an imperfect measure given the inconsistencies in how servicers are accounting for loans in forbearance across different sectors of mortgage credit, but it should provide a reasonable guide to areas of the market that may be faring better than others. Looking at loans that were at least 90-days past due in the September remittance and comparing the same population of loans to their October status shows that the overwhelming majority across all sectors of the market are still seriously delinquent, likely a function of extended forbearance plans. However, two areas of the market, the prime and non-QM sectors exhibited a reasonable uptick in month-over-month payment velocity measured as the loan rolling back to current, an earlier stage of delinquency or prepaying in October. (Exhibit 1)
Exhibit 1: Payment velocity improves in prime & non-QM
Source: Amherst Insight Labs, Amherst Pierpont
Digging in on the prime jumbo sector
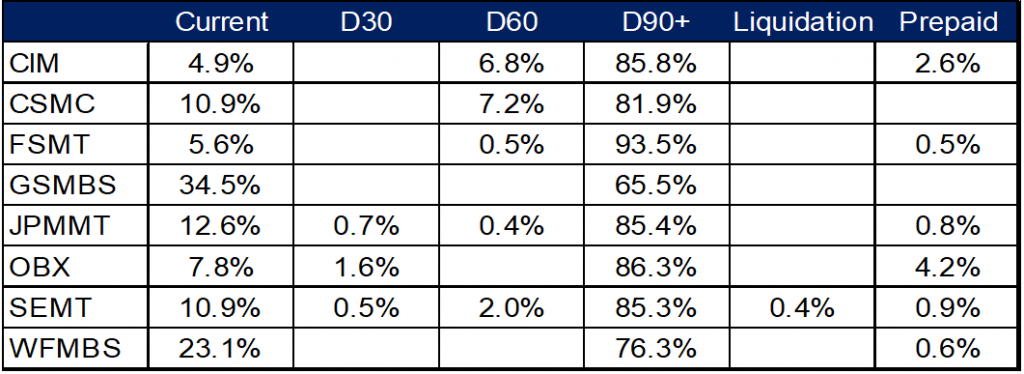
Looking at shelf level performance across the prime 2.0 sector, the GSMBS and WFMBS shelves exhibited the strongest payment velocity. Over one third of loans that were more than 90-days past due in September were current in October while nearly a quarter of loans in the WFMBS shelf transitioned from seriously delinquent to current over the payment cycle. These outsized improvements in payment velocity compared to other shelves could be driven by one of two factors. The obvious one being that the borrower exited a short-term forbearance plan, repaid all arrearages and is now current pay. Alternatively, the roll to current could be the result of the servicer performing a capitalization modification by appending the arrearages to the borrowers’ loan balance. A further analysis of servicer behavior across these shelves suggests that the observed payment velocity is actually a function of the former rather than the latter. The WFMBS shelf saw no capitalization modifications in the July remittance while the GSMBS shelf saw just 20 bp of capitalization modifications which appear to be associated with newly delinquent loans. (Exhibit 2)
Exhibit 2: GSMBS & WFMBS shelves exhibit strong payment velocity in October
Source: Amherst Insight Labs, Amherst Pierpont
Rolling down to the deal level, it appears the greatest populations of loans rolling from delinquent to current were in WFMBS 2019-4 where nearly half the serious delinquencies transitioned back to current in October. Roughly one quarter of loans in WFMBS 2018-1 rolled to current in October. The GSMBS 2020-PJ2 trust saw all loans greater than 90-days delinquent cure in October. Other trusts exhibited strong increases in payment velocity relative to their broader trust levels, JPMMT 2018-2, the issuer’s first 100% conforming balance transaction, saw roughly 30% of loans that were seriously delinquent fully re-perform in October.
Digging in on the non-QM sector
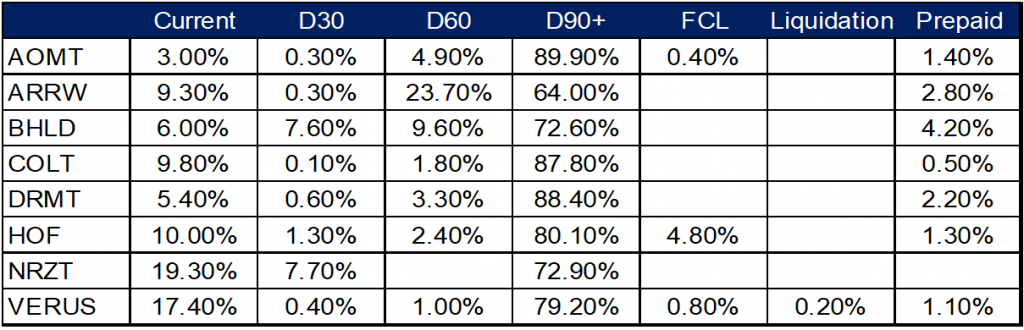
Non-QM collateral exhibited the most sizable recovery in payment velocity across all sectors of mortgage credit in October with almost 20% of loans in late stage delinquency exhibiting some form of payment velocity in October. Admittedly, loans rolling back to current were by and large not as pronounced among non-QM borrowers than evident in the prime sector. With that said, overall decreases in late stage delinquencies after accounting for both prepayments and loans rolling back to a less delinquent state were higher in non-QM than in prime collateral with the ARRW, BHLD and NRZT shelves showing the most pronounced improvements in collateral performance. (Exhibit 3)
Exhibit 3: A look at late stage delinquencies curing across non-QM
Source: Amherst Insight Labs, Amherst Pierpont
Increased payment velocity in WAMCO’s ARRW shelf was largely driven by nearly a quarter of borrowers that were previously 90 days or more past due catching up on a single payment. Improved performance across Oaktree’s BHLD shelf was much more broad-based, fueled in part by nearly 5% of previously seriously delinquent loans prepaying in the October cycle. New Residential’s NRZT shelf saw nearly 20% of previously seriously delinquent loans roll to current in October. These loans appear to be self-curing rather than a result of capitalization modifications as those modification rates across the shelf have fallen from 87% of delinquent loans in June to roughly 5% of delinquencies in October.
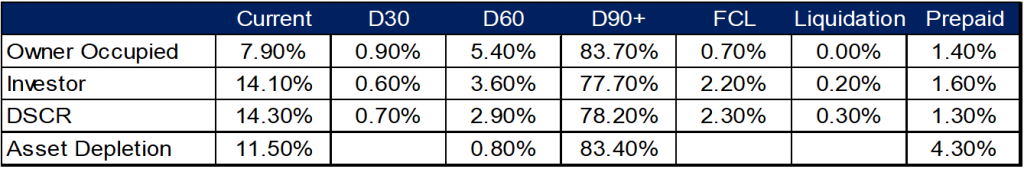
An analysis of select non-QM collateral and underwriting characteristics shows that non-QM investor loans exhibited better payment velocity in October than owner occupied loans. Nearly 15% of previously seriously delinquent investor loans cured in October while the rate for owner occupied loans was roughly half that. The improvement in payment velocity appears to be fueled in no small part by the performance of loans underwritten to properties’ DSCR as those cure rates were roughly in-line with those of the broader investor cohort. While payment velocity was modestly better on loans underwritten using asset depletion than broader performance of owner occupied loans. (Exhibit 4)
Exhibit 4: Evaluating payment velocity across select non-QM cohorts
Source: Amherst Insight Labs, Amherst Pierpont
Given overall uncertainty with regards to the impact of the pandemic on borrower performance, continued monitoring of these trends should remain on the forefront in evaluating performance across different sectors of mortgage credit. The early signs suggest that improved underwriting and greater amounts of paid-in equity at origination are driving a faster and stronger and faster recovery in post-crisis borrowers relative to pre-crisis ones.
This material is intended only for institutional investors and does not carry all of the independence and disclosure standards of retail debt research reports. In the preparation of this material, the author may have consulted or otherwise discussed the matters referenced herein with one or more of SCM’s trading desks, any of which may have accumulated or otherwise taken a position, long or short, in any of the financial instruments discussed in or related to this material. Further, SCM may act as a market maker or principal dealer and may have proprietary interests that differ or conflict with the recipient hereof, in connection with any financial instrument discussed in or related to this material.
This message, including any attachments or links contained herein, is subject to important disclaimers, conditions, and disclosures regarding Electronic Communications, which you can find at https://portfolio-strategy.apsec.com/sancap-disclaimers-and-disclosures.
Important Disclaimers
Copyright © 2026 Santander US Capital Markets LLC and its affiliates (“SCM”). All rights reserved. SCM is a member of FINRA and SIPC. This material is intended for limited distribution to institutions only and is not publicly available. Any unauthorized use or disclosure is prohibited.
In making this material available, SCM (i) is not providing any advice to the recipient, including, without limitation, any advice as to investment, legal, accounting, tax and financial matters, (ii) is not acting as an advisor or fiduciary in respect of the recipient, (iii) is not making any predictions or projections and (iv) intends that any recipient to which SCM has provided this material is an “institutional investor” (as defined under applicable law and regulation, including FINRA Rule 4512 and that this material will not be disseminated, in whole or part, to any third party by the recipient.
The author of this material is an economist, desk strategist or trader. In the preparation of this material, the author may have consulted or otherwise discussed the matters referenced herein with one or more of SCM’s trading desks, any of which may have accumulated or otherwise taken a position, long or short, in any of the financial instruments discussed in or related to this material. Further, SCM or any of its affiliates may act as a market maker or principal dealer and may have proprietary interests that differ or conflict with the recipient hereof, in connection with any financial instrument discussed in or related to this material.
This material (i) has been prepared for information purposes only and does not constitute a solicitation or an offer to buy or sell any securities, related investments or other financial instruments, (ii) is neither research, a “research report” as commonly understood under the securities laws and regulations promulgated thereunder nor the product of a research department, (iii) or parts thereof may have been obtained from various sources, the reliability of which has not been verified and cannot be guaranteed by SCM, (iv) should not be reproduced or disclosed to any other person, without SCM’s prior consent and (v) is not intended for distribution in any jurisdiction in which its distribution would be prohibited.
In connection with this material, SCM (i) makes no representation or warranties as to the appropriateness or reliance for use in any transaction or as to the permissibility or legality of any financial instrument in any jurisdiction, (ii) believes the information in this material to be reliable, has not independently verified such information and makes no representation, express or implied, with regard to the accuracy or completeness of such information, (iii) accepts no responsibility or liability as to any reliance placed, or investment decision made, on the basis of such information by the recipient and (iv) does not undertake, and disclaims any duty to undertake, to update or to revise the information contained in this material.
Unless otherwise stated, the views, opinions, forecasts, valuations, or estimates contained in this material are those solely of the author, as of the date of publication of this material, and are subject to change without notice. The recipient of this material should make an independent evaluation of this information and make such other investigations as the recipient considers necessary (including obtaining independent financial advice), before transacting in any financial market or instrument discussed in or related to this material.
Important disclaimers for clients in the EU and UK
This publication has been prepared by Trading Desk Strategists within the Sales and Trading functions of Santander US Capital Markets LLC (“SanCap”), the US registered broker-dealer of Santander Corporate & Investment Banking. This communication is distributed in the EEA by Banco Santander S.A., a credit institution registered in Spain and authorised and regulated by the Bank of Spain and the CNMV. Any EEA recipient of this communication that would like to affect any transaction in any security or issuer discussed herein should do so with Banco Santander S.A. or any of its affiliates (together “Santander”). This communication has been distributed in the UK by Banco Santander, S.A.’s London branch, authorised by the Bank of Spain and subject to regulatory oversight on certain matters by the Financial Conduct Authority (FCA) and the Prudential Regulation Authority (PRA).
The publication is intended for exclusive use for Professional Clients and Eligible Counterparties as defined by MiFID II and is not intended for use by retail customers or for any persons or entities in any jurisdictions or country where such distribution or use would be contrary to local law or regulation.
This material is not a product of Santander´s Research Team and does not constitute independent investment research. This is a marketing communication and may contain ¨investment recommendations¨ as defined by the Market Abuse Regulation 596/2014 ("MAR"). This publication has not been prepared in accordance with legal requirements designed to promote the independence of research and is not subject to any prohibition on dealing ahead of the dissemination of investment research. The author, date and time of the production of this publication are as indicated herein.
This publication does not constitute investment advice and may not be relied upon to form an investment decision, nor should it be construed as any offer to sell or issue or invitation to purchase, acquire or subscribe for any instruments referred herein. The publication has been prepared in good faith and based on information Santander considers reliable as of the date of publication, but Santander does not guarantee or represent, express or implied, that such information is accurate or complete. All estimates, forecasts and opinions are current as at the date of this publication and are subject to change without notice. Unless otherwise indicated, Santander does not intend to update this publication. The views and commentary in this publication may not be objective or independent of the interests of the Trading and Sales functions of Santander, who may be active participants in the markets, investments or strategies referred to herein and/or may receive compensation from investment banking and non-investment banking services from entities mentioned herein. Santander may trade as principal, make a market or hold positions in instruments (or related derivatives) and/or hold financial interest in entities discussed herein. Santander may provide market commentary or trading strategies to other clients or engage in transactions which may differ from views expressed herein. Santander may have acted upon the contents of this publication prior to you having received it.
This publication is intended for the exclusive use of the recipient and must not be reproduced, redistributed or transmitted, in whole or in part, without Santander’s consent. The recipient agrees to keep confidential at all times information contained herein.


