Uncategorized
A landscape of rising prepayments in agency multifamily
admin | October 30, 2020
This material is a Marketing Communication and does not constitute Independent Investment Research.
The sharp drop in interest rates this year has accelerated prepayments in most agency multifamily loans despite often significant penalties required to prepay. Penalties in Ginnie Mae project loans, Freddie Mac small balance loans and floating-rate K-series typically decline over time, and these loans are seeing some of the fastest prepayments. Loan size and product type matter, with fixed-rate small balance loans repaying a bit faster than hybrid ARMs. IO investors need to pay attention since the downside from principal prepayments can offset the upside from collecting penalties.
Opportunity and decision
The decision to refinance a multifamily loan is fundamentally driven by the same factors as a single-family loan–the value of the rate incentive and the ability or desire to tap equity in the property. The prepayment penalties make the hurdle to refinancing higher, and the additional scrutiny of borrower financials and re-evaluation of the property can make the process more cumbersome.
Over the last decade the yield on the 10-year Treasury has ranged from a high of 4.00% to a recent low of 0.50% (Exhibit 1). Purely based on rate incentive, the vintages with the strongest incentive to refinance include 2010, 2011 and 2018, when rates were close to or above 3.00% for most of the year. However, the recent pandemic-induced rally has meant even loans that refinanced during the previous troughs in 2012 and 2016 now have up to a 100 bp incentive before accounting for prepayment penalties.
Exhibit 1: The 10-year Treasury rate has varied significantly over the last decade
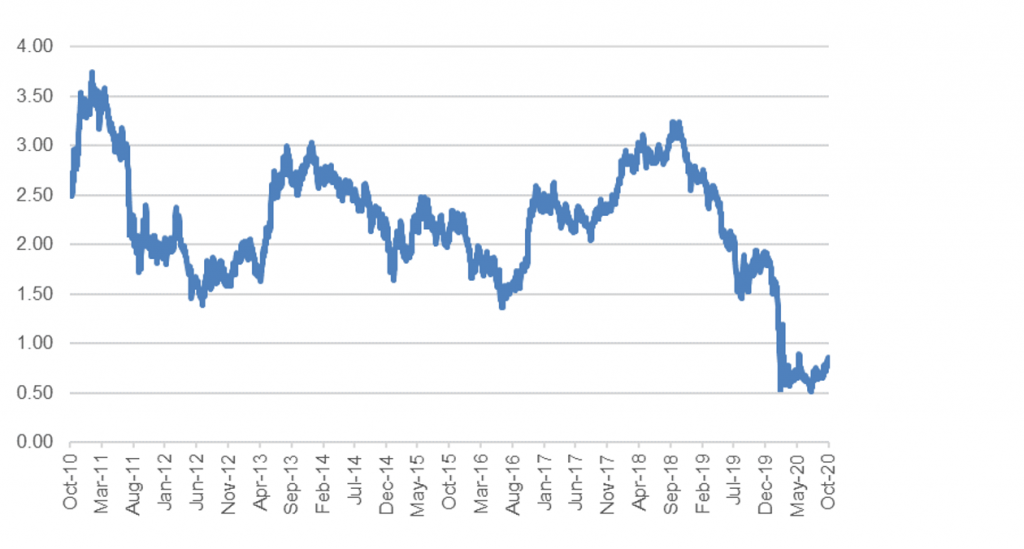
Note: on-the-run rate.
Source: Bloomberg
Ginnie Mae Project Loans
Prepayment penalties in Ginnie Mae project loans typically start at 9% to 10% of the outstanding balance after any lockout expires and decline by 1% per year over 10 years. Speeds in Ginnie Mae project loans picked up again in October for most penalty cohorts, though the 1- to 3-point and 7- to 8-point penalty cohorts show signs of stabilization (Exhibit 2).
Exhibit 2: Ginnie Mae project loan prepayment speeds by penalty amount
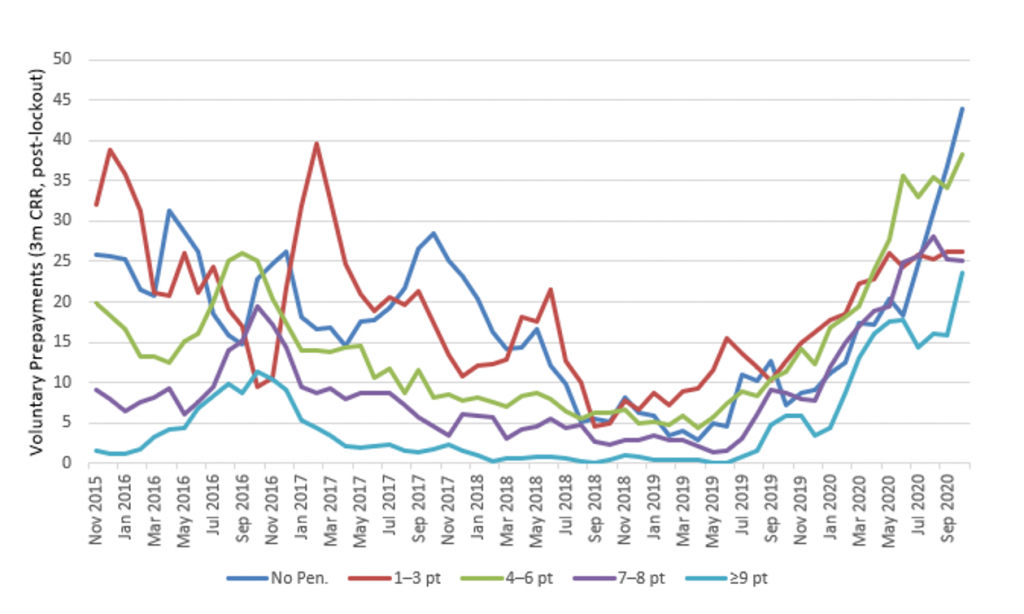
Source: Intex, Amherst Pierpont Securities
Loans with the largest prepayment penalties are actually reaching speeds close to 25 CRR. Over the past year speeds have been above the long-term historical average based on refinance incentive for all but the highest levels of incentive where these very old, high rate loans are clearly showing significant burnout (Exhibit 3).
Exhibit 3: Ginnie Mae project loan S-curves by rate incentive
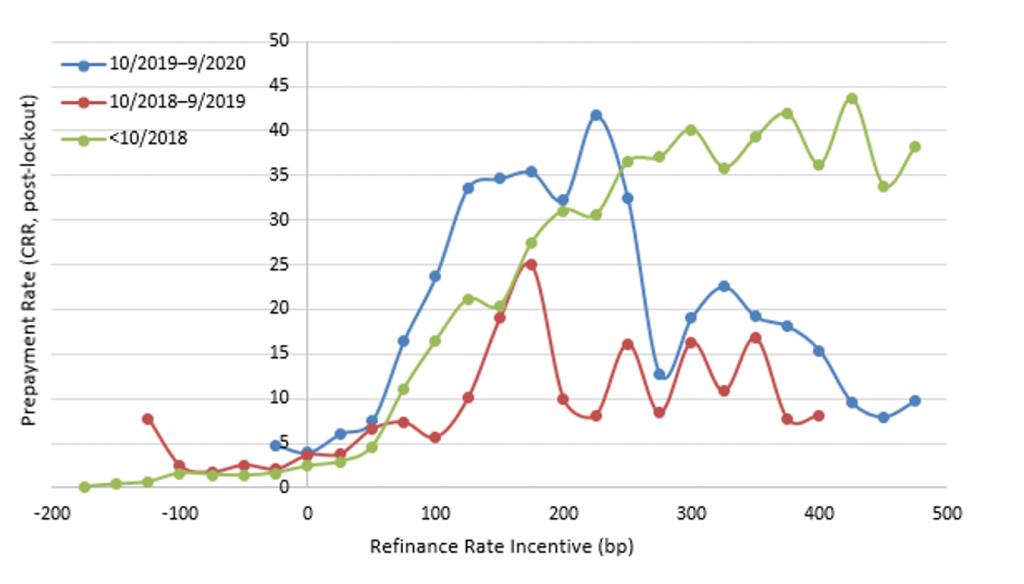
Source: Intex, Amherst Pierpont Securities
The impact of refinance incentive tends to be persistent over time, with vintages that have higher average rates having faster lifetime CPRs than those with lower rates (Exhibit 4). The relatively higher rate vintages in 2010, 2011, 2014 and 2019 have the highest lifetime CPRs of the vintages of the past decade. The 2017 vintage, which has a lot of loans originated in the rate trough of the second half of 2016, has the slowest lifetime CPR at 3.6, excluding the 2020 vintage where rates are even lower. Those 2016-2017 vintage loans are also those with 7- to 8-point penalties remaining under the most common scheme, which explains why that cohort is prepaying somewhat slower than expected all else being equal.
Exhibit 4: Ginnie Mae project loan prepayment speeds by year since issuance
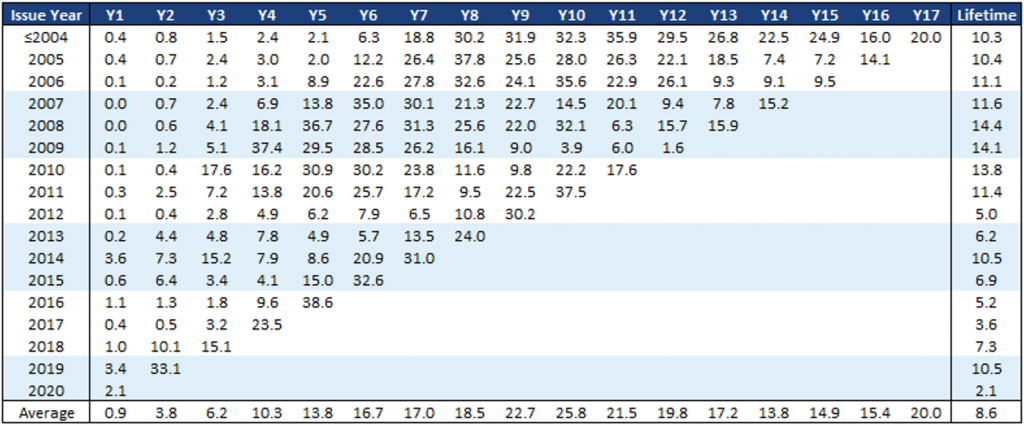
Note: CPR speeds include voluntary and involuntary prepayments.
Source: Intex, Amherst Pierpont Securities
Prepayments in small balance loans are slower and influenced by loan type
Freddie Mac’s small balance loans have a variety of different loan structures and their prepayment penalties overall tend to be considerably lower than those in Ginnie Mae project loans, Freddie K-series and Fannie Mae DUS. For example, when FRESB loans have a point system they often start at 5% or 3% of the outstanding balance as a prepayment penalty, which declines over three to five years, then remains at 1% for most of the remaining term. Despite the lower overall penalty structure, FRESB loans tend to prepay more slowly regardless of the rate incentive, then accelerate as the loan approaches the balloon payment or the end of the IO period (Exhibit 5). The prepayment speeds for the A5F (fixed-rate) and A5H (hybrid ARM) tranches, either have a balloon payment or begin to amortize down at the 5-year mark. These tranches, as seen in the 2015 vintages, have speeds that tend to rise gradually over time then jump higher at the balloon or amortization threshold.
Exhibit 5: FRESB prepayment speeds by loan vintage and tranche
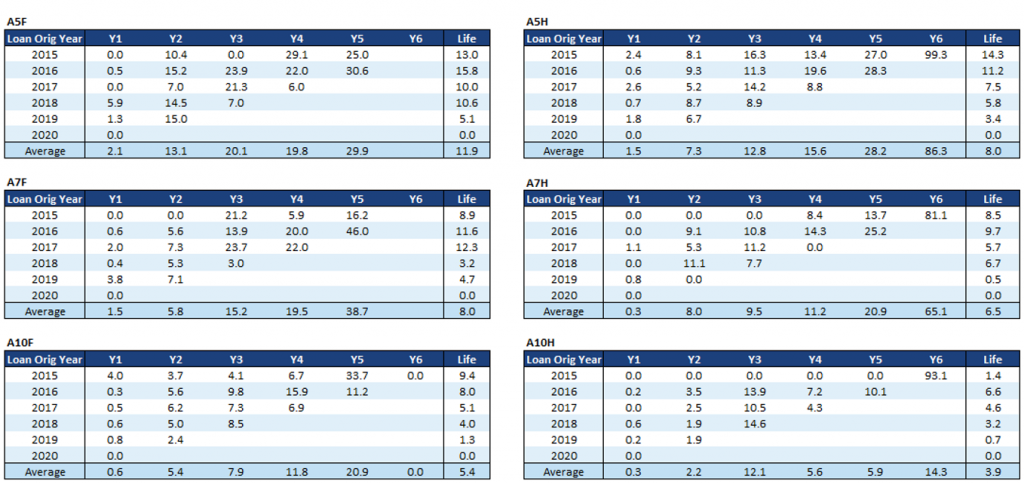
Note: CPR speeds include voluntary and involuntary prepayments. Average speeds include 2014 vintages which are not shown in the tables above.
Source: Intex, Amherst Pierpont Securities
Notably the lifetime speeds by vintage, and the average historical speed by tranche type, both tend to be a bit higher for the fixed-rate loans than those of the hybrid ARMs. This could be because the teaser rates for the hybrid ARMs tend to be lower than those for comparable vintage fixed-rate loans so the rate incentive is somewhat lower, or it could reflect a stronger borrower preference to avoid a balloon payment in fixed-rate loans as opposed to an amortization period that’s more common when the ARM transitions from fixed to floating. Either way it’s a persistent enough difference that IO investors who want slower speeds should favor the hybrid ARM tranches across all terms.
Freddie Mac K-series floaters prepay faster than supplementals
Prepayments are tracked in Freddie Mac K-series floaters (K-Fs) and supplemental loans (K-Js). Across almost all vintages floaters prepay somewhat to considerably faster than supplemental loans (Exhibit 6), with the most recent 2019 vintage being the lone exception.
Exhibit 6: Prepayment speeds ramps by vintage
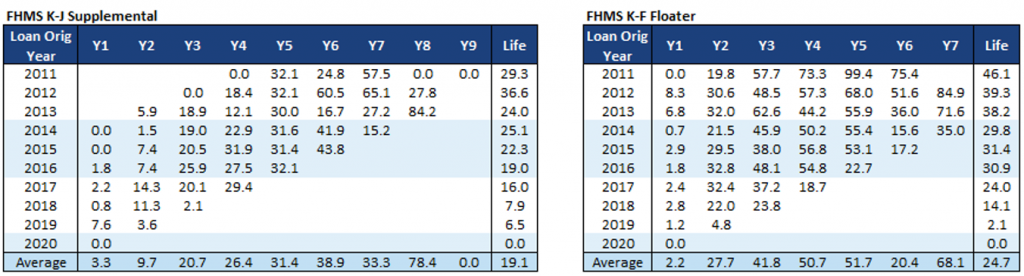
Note: CPR speeds include voluntary and involuntary prepayments.
Source: Intex, Amherst Pierpont Securities
The supplemental loans have much higher coupons than the floaters, so it’s not purely a rate incentive story. Prepayment speeds in supplementals are likely following prepayments on the first lien loans. Those loans could have additional credit concerns or the additional debt may make refinancing more difficult. The additional loan isn’t a significant deterrent, as the lifetime speeds on the supplemental and floating rate loans by vintage are much faster than the speeds on Ginnie Mae project loans. K-series loans generally tend to be much larger in size than Ginnie Mae project loans – roughly $13 million at origination versus $5.5 million. The borrowers may be more sophisticated and tend towards professional developers with larger portfolios of projects, who aggressively refinance or sell properties when the opportunity arises.
This material is intended only for institutional investors and does not carry all of the independence and disclosure standards of retail debt research reports. In the preparation of this material, the author may have consulted or otherwise discussed the matters referenced herein with one or more of SCM’s trading desks, any of which may have accumulated or otherwise taken a position, long or short, in any of the financial instruments discussed in or related to this material. Further, SCM may act as a market maker or principal dealer and may have proprietary interests that differ or conflict with the recipient hereof, in connection with any financial instrument discussed in or related to this material.
This message, including any attachments or links contained herein, is subject to important disclaimers, conditions, and disclosures regarding Electronic Communications, which you can find at https://portfolio-strategy.apsec.com/sancap-disclaimers-and-disclosures.
Important Disclaimers
Copyright © 2026 Santander US Capital Markets LLC and its affiliates (“SCM”). All rights reserved. SCM is a member of FINRA and SIPC. This material is intended for limited distribution to institutions only and is not publicly available. Any unauthorized use or disclosure is prohibited.
In making this material available, SCM (i) is not providing any advice to the recipient, including, without limitation, any advice as to investment, legal, accounting, tax and financial matters, (ii) is not acting as an advisor or fiduciary in respect of the recipient, (iii) is not making any predictions or projections and (iv) intends that any recipient to which SCM has provided this material is an “institutional investor” (as defined under applicable law and regulation, including FINRA Rule 4512 and that this material will not be disseminated, in whole or part, to any third party by the recipient.
The author of this material is an economist, desk strategist or trader. In the preparation of this material, the author may have consulted or otherwise discussed the matters referenced herein with one or more of SCM’s trading desks, any of which may have accumulated or otherwise taken a position, long or short, in any of the financial instruments discussed in or related to this material. Further, SCM or any of its affiliates may act as a market maker or principal dealer and may have proprietary interests that differ or conflict with the recipient hereof, in connection with any financial instrument discussed in or related to this material.
This material (i) has been prepared for information purposes only and does not constitute a solicitation or an offer to buy or sell any securities, related investments or other financial instruments, (ii) is neither research, a “research report” as commonly understood under the securities laws and regulations promulgated thereunder nor the product of a research department, (iii) or parts thereof may have been obtained from various sources, the reliability of which has not been verified and cannot be guaranteed by SCM, (iv) should not be reproduced or disclosed to any other person, without SCM’s prior consent and (v) is not intended for distribution in any jurisdiction in which its distribution would be prohibited.
In connection with this material, SCM (i) makes no representation or warranties as to the appropriateness or reliance for use in any transaction or as to the permissibility or legality of any financial instrument in any jurisdiction, (ii) believes the information in this material to be reliable, has not independently verified such information and makes no representation, express or implied, with regard to the accuracy or completeness of such information, (iii) accepts no responsibility or liability as to any reliance placed, or investment decision made, on the basis of such information by the recipient and (iv) does not undertake, and disclaims any duty to undertake, to update or to revise the information contained in this material.
Unless otherwise stated, the views, opinions, forecasts, valuations, or estimates contained in this material are those solely of the author, as of the date of publication of this material, and are subject to change without notice. The recipient of this material should make an independent evaluation of this information and make such other investigations as the recipient considers necessary (including obtaining independent financial advice), before transacting in any financial market or instrument discussed in or related to this material.
Important disclaimers for clients in the EU and UK
This publication has been prepared by Trading Desk Strategists within the Sales and Trading functions of Santander US Capital Markets LLC (“SanCap”), the US registered broker-dealer of Santander Corporate & Investment Banking. This communication is distributed in the EEA by Banco Santander S.A., a credit institution registered in Spain and authorised and regulated by the Bank of Spain and the CNMV. Any EEA recipient of this communication that would like to affect any transaction in any security or issuer discussed herein should do so with Banco Santander S.A. or any of its affiliates (together “Santander”). This communication has been distributed in the UK by Banco Santander, S.A.’s London branch, authorised by the Bank of Spain and subject to regulatory oversight on certain matters by the Financial Conduct Authority (FCA) and the Prudential Regulation Authority (PRA).
The publication is intended for exclusive use for Professional Clients and Eligible Counterparties as defined by MiFID II and is not intended for use by retail customers or for any persons or entities in any jurisdictions or country where such distribution or use would be contrary to local law or regulation.
This material is not a product of Santander´s Research Team and does not constitute independent investment research. This is a marketing communication and may contain ¨investment recommendations¨ as defined by the Market Abuse Regulation 596/2014 ("MAR"). This publication has not been prepared in accordance with legal requirements designed to promote the independence of research and is not subject to any prohibition on dealing ahead of the dissemination of investment research. The author, date and time of the production of this publication are as indicated herein.
This publication does not constitute investment advice and may not be relied upon to form an investment decision, nor should it be construed as any offer to sell or issue or invitation to purchase, acquire or subscribe for any instruments referred herein. The publication has been prepared in good faith and based on information Santander considers reliable as of the date of publication, but Santander does not guarantee or represent, express or implied, that such information is accurate or complete. All estimates, forecasts and opinions are current as at the date of this publication and are subject to change without notice. Unless otherwise indicated, Santander does not intend to update this publication. The views and commentary in this publication may not be objective or independent of the interests of the Trading and Sales functions of Santander, who may be active participants in the markets, investments or strategies referred to herein and/or may receive compensation from investment banking and non-investment banking services from entities mentioned herein. Santander may trade as principal, make a market or hold positions in instruments (or related derivatives) and/or hold financial interest in entities discussed herein. Santander may provide market commentary or trading strategies to other clients or engage in transactions which may differ from views expressed herein. Santander may have acted upon the contents of this publication prior to you having received it.
This publication is intended for the exclusive use of the recipient and must not be reproduced, redistributed or transmitted, in whole or in part, without Santander’s consent. The recipient agrees to keep confidential at all times information contained herein.


