Uncategorized
Proactive debt management should flatten AT&T curve
admin | October 23, 2020
This material is a Marketing Communication and does not constitute Independent Investment Research.
While AT&T Corporation (T, Baa2/BBB/A-) reported solid third quarter results underscored by better than expected wireless subscriber growth, the company’s proactive approach to managing the balance sheet this year has been the real highlight for the credit. Since the first quarter of 2020, T has reduced or extended over $30 billion in near term maturities, thereby smoothing its debt towers and reducing overall leverage. Despite a lackluster equity performance, further debt reduction remains management’s number one capital allocation priority, which could lead to a flattening of the 10s/30s part of AT&T’s debt curve relative to peer Verizon.
T has reduced debt maturities by over 50% for the next five years and has reduced its average coupon rate to just below 4.1% (from 4.3%) while extending its weighted average maturity by four years, to 17 years. Net debt now stands at $149 billion, which is down from $180 billion since the close of the Time Warner acquisition. That said, leverage at 2.66x is close to management’s target of 2.5x. While the company had briefly hit their leverage target at the end of last year, the reduction in EBITDA driven by the pandemic pushed leverage roughly over a tick higher. Management believes that creating a strong balance sheet and consistent results will translate to better equity performance than increasing share buybacks.
Exhibit 1: T 2020-2025 Debt Towers 3Q20 vs. 1Q20 ($ in billions)
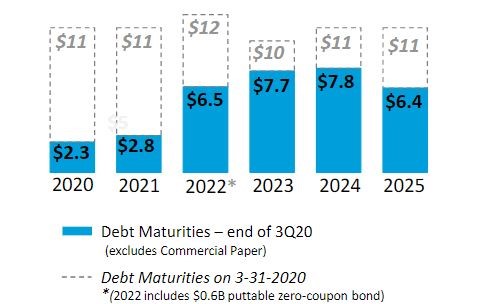
Source: AT&T earnings presentation, Amherst Pierpont Securities
AT&T’s debt curve is plotted against the BBB communications curve and Verizon’s (VZ – Baa1 (p)/BBB+ (p)/A-) curve (Exhibit 2) to compare the relative steepness of the 10s/30s sector. While the spread differential between T and VZ is closer to 50 bp in the 10-year part of the curve, it is over 80 bp in the 30-year part of the curve. Additionally, the relationship between the two credits in 30-year CDS is approximately 47 bp. This would indicate that that T’s curve is too steep relative to its higher rated peer and investors could expect the curve to flatten as T continues to prioritize debt reduction. Lastly, T traded only 50 bp behind VZ in the 30-year part of the curve this time last year.
Exhibit 2. T Curve vs. VZ & BBB Communications Curves
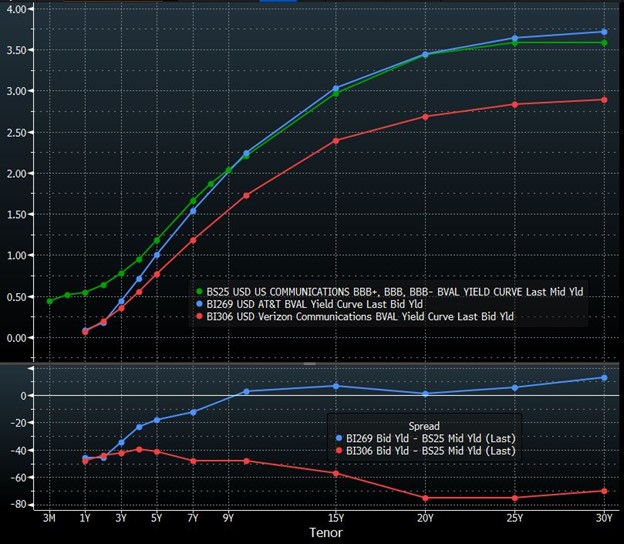
Source: Bloomberg/TRACE indications, Amherst Pierpont Securities
Further Asset Sales to Come – DirecTV?
While T is expecting $3 billion of previously announced asset sales to close before year–end, including disposition of its CME assets which closed last week, management is exploring the possibility of further asset sales. As noted on its earnings call, with over $500 billion of assets on the balance sheet, it gives T ample opportunity to continue to strengthen its balance sheet and cash position by monetizing non-core assets. That begs the question, is DirecTV on the chopping block?
Elliot Management Corporation disclosed that it had taken a $3.2 billion stake in T last year. Since then, its position has increased to $5 billion. At the time of taking its initial position, Elliot Investment Management questioned some of T’s acquisitions (including DirecTV) and challenged them to rethink its strategic rationale behind holding on to certain assets that they deem non-core. Elliot Management’s view is that bigger is not always necessarily better, thereby making T an “outlier” in the communications sector as it continues to make large acquisitions. Additionally it was rumored in early September that T was in talks with private equity firms over a potential sale of the unit. A sale to private equity might be the most likely outcome as it could circumvent any type of regulatory concerns.
A sale of DirecTV would be a positive for T bondholders as the asset is so large that a sale would require further significant debt reduction. This would accelerate T’s debt reduction plans and help the company to achieve its longer term leverage target of 2.0x (expected to be achieved by 2022), and it would enable T to shed an underperforming asset. DirecTV has been witnessing subscriber declines given the rise of streaming services such as Netflix, which has prompted the growing “cord cutting” movement. T purchased DirecTV at the height of satellite, and while it witnessed some subscriber growth at the unit post close from July 2015 through the end of 2016, DirecTV has posted subscriber losses since.
This material is intended only for institutional investors and does not carry all of the independence and disclosure standards of retail debt research reports. In the preparation of this material, the author may have consulted or otherwise discussed the matters referenced herein with one or more of SCM’s trading desks, any of which may have accumulated or otherwise taken a position, long or short, in any of the financial instruments discussed in or related to this material. Further, SCM may act as a market maker or principal dealer and may have proprietary interests that differ or conflict with the recipient hereof, in connection with any financial instrument discussed in or related to this material.
This message, including any attachments or links contained herein, is subject to important disclaimers, conditions, and disclosures regarding Electronic Communications, which you can find at https://portfolio-strategy.apsec.com/sancap-disclaimers-and-disclosures.
Important Disclaimers
Copyright © 2026 Santander US Capital Markets LLC and its affiliates (“SCM”). All rights reserved. SCM is a member of FINRA and SIPC. This material is intended for limited distribution to institutions only and is not publicly available. Any unauthorized use or disclosure is prohibited.
In making this material available, SCM (i) is not providing any advice to the recipient, including, without limitation, any advice as to investment, legal, accounting, tax and financial matters, (ii) is not acting as an advisor or fiduciary in respect of the recipient, (iii) is not making any predictions or projections and (iv) intends that any recipient to which SCM has provided this material is an “institutional investor” (as defined under applicable law and regulation, including FINRA Rule 4512 and that this material will not be disseminated, in whole or part, to any third party by the recipient.
The author of this material is an economist, desk strategist or trader. In the preparation of this material, the author may have consulted or otherwise discussed the matters referenced herein with one or more of SCM’s trading desks, any of which may have accumulated or otherwise taken a position, long or short, in any of the financial instruments discussed in or related to this material. Further, SCM or any of its affiliates may act as a market maker or principal dealer and may have proprietary interests that differ or conflict with the recipient hereof, in connection with any financial instrument discussed in or related to this material.
This material (i) has been prepared for information purposes only and does not constitute a solicitation or an offer to buy or sell any securities, related investments or other financial instruments, (ii) is neither research, a “research report” as commonly understood under the securities laws and regulations promulgated thereunder nor the product of a research department, (iii) or parts thereof may have been obtained from various sources, the reliability of which has not been verified and cannot be guaranteed by SCM, (iv) should not be reproduced or disclosed to any other person, without SCM’s prior consent and (v) is not intended for distribution in any jurisdiction in which its distribution would be prohibited.
In connection with this material, SCM (i) makes no representation or warranties as to the appropriateness or reliance for use in any transaction or as to the permissibility or legality of any financial instrument in any jurisdiction, (ii) believes the information in this material to be reliable, has not independently verified such information and makes no representation, express or implied, with regard to the accuracy or completeness of such information, (iii) accepts no responsibility or liability as to any reliance placed, or investment decision made, on the basis of such information by the recipient and (iv) does not undertake, and disclaims any duty to undertake, to update or to revise the information contained in this material.
Unless otherwise stated, the views, opinions, forecasts, valuations, or estimates contained in this material are those solely of the author, as of the date of publication of this material, and are subject to change without notice. The recipient of this material should make an independent evaluation of this information and make such other investigations as the recipient considers necessary (including obtaining independent financial advice), before transacting in any financial market or instrument discussed in or related to this material.
Important disclaimers for clients in the EU and UK
This publication has been prepared by Trading Desk Strategists within the Sales and Trading functions of Santander US Capital Markets LLC (“SanCap”), the US registered broker-dealer of Santander Corporate & Investment Banking. This communication is distributed in the EEA by Banco Santander S.A., a credit institution registered in Spain and authorised and regulated by the Bank of Spain and the CNMV. Any EEA recipient of this communication that would like to affect any transaction in any security or issuer discussed herein should do so with Banco Santander S.A. or any of its affiliates (together “Santander”). This communication has been distributed in the UK by Banco Santander, S.A.’s London branch, authorised by the Bank of Spain and subject to regulatory oversight on certain matters by the Financial Conduct Authority (FCA) and the Prudential Regulation Authority (PRA).
The publication is intended for exclusive use for Professional Clients and Eligible Counterparties as defined by MiFID II and is not intended for use by retail customers or for any persons or entities in any jurisdictions or country where such distribution or use would be contrary to local law or regulation.
This material is not a product of Santander´s Research Team and does not constitute independent investment research. This is a marketing communication and may contain ¨investment recommendations¨ as defined by the Market Abuse Regulation 596/2014 ("MAR"). This publication has not been prepared in accordance with legal requirements designed to promote the independence of research and is not subject to any prohibition on dealing ahead of the dissemination of investment research. The author, date and time of the production of this publication are as indicated herein.
This publication does not constitute investment advice and may not be relied upon to form an investment decision, nor should it be construed as any offer to sell or issue or invitation to purchase, acquire or subscribe for any instruments referred herein. The publication has been prepared in good faith and based on information Santander considers reliable as of the date of publication, but Santander does not guarantee or represent, express or implied, that such information is accurate or complete. All estimates, forecasts and opinions are current as at the date of this publication and are subject to change without notice. Unless otherwise indicated, Santander does not intend to update this publication. The views and commentary in this publication may not be objective or independent of the interests of the Trading and Sales functions of Santander, who may be active participants in the markets, investments or strategies referred to herein and/or may receive compensation from investment banking and non-investment banking services from entities mentioned herein. Santander may trade as principal, make a market or hold positions in instruments (or related derivatives) and/or hold financial interest in entities discussed herein. Santander may provide market commentary or trading strategies to other clients or engage in transactions which may differ from views expressed herein. Santander may have acted upon the contents of this publication prior to you having received it.
This publication is intended for the exclusive use of the recipient and must not be reproduced, redistributed or transmitted, in whole or in part, without Santander’s consent. The recipient agrees to keep confidential at all times information contained herein.


