


Uncategorized
The risk-takers outrun the market through September
admin | October 9, 2020
This document is intended for institutional investors and is not subject to all of the independence and disclosure standards applicable to debt research reports prepared for retail investors. This material does not constitute research.
The stretch from July to September turned out to be a good time to manage CLOs. Nearly 60% of managers with five or more active deals beat the returns of the broad loan market. The average CLO leveraged loan portfolio delivered 4.27% and, after adjusting for broad market exposure, or beta, topped the market by 0.13%. Managers holding loans with lower bid depth or wider spreads at the end of June led the pack. And managers who kept a rein on the tail risk of their portfolios also tended to outperform through September.
Loan returns rose steadily between July and mid-September before taking a breather into early October (Exhibit 1). The index has now remained at its pre-coronavirus level. After accounting for the various reporting dates of managers, the S&P/LSTA Index gained 4% between July and September. Managers held portfolios with an average beta of 1.04, which meant the average manager should have gained 4.14%. With actual average performance of 4.27%, the average manager outperformed the index by 0.13%.
Exhibit 1: Loan returns have flattened going into October

Source: Bloomberg, Amherst Pierpont Securities
About 59% of the managers led the index, a small uptick from the figures reported by Amherst Pierpont last month (Exhibit 2). Of the 73 managers tracked for July through September, four delivered alpha greater than 1%, while none trailed the index by 1% or more.
Exhibit 2: More than half of the managers outperformed the index between July and September

Note: data shows excess return only for active deals.
Source: Amherst Pierpont Securities.
The weighted average spread and bid depth of the portfolio correlated most strongly with recent excess returns (Exhibit 3). Managers who held loans that have wider spreads or receive fewer bids delivered higher returns. Additionally, higher exposure to ‘Caa1’ and lower weighted average loan price correlated with more recent excess returns. These relationships indicate that managers holding riskier loans continued to outperform between July and September.
Exhibit 3: Correlation of portfolio or manager features with recent excess return
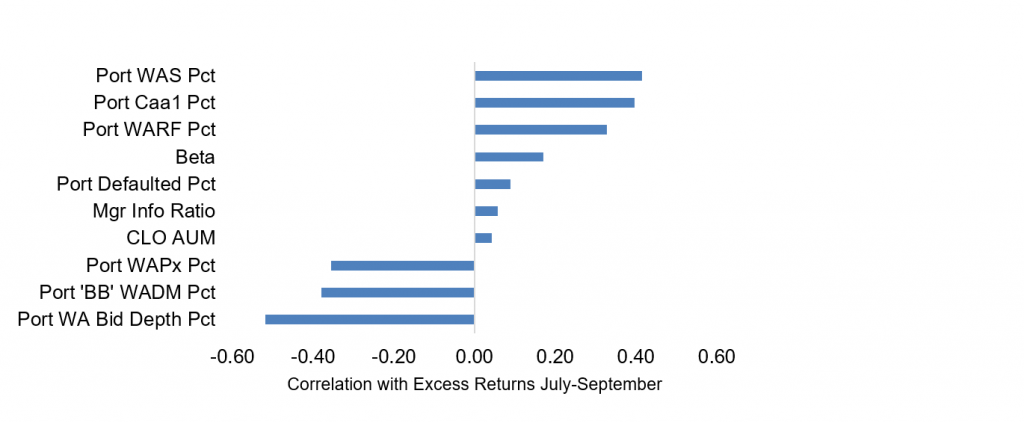
Note: data shows the correlation of manager or loan portfolio attribute with managers’ excess return or alpha from July through September only on active deals. Portfolio attributes measured as percentiles.
Source: Amherst Pierpont Securities.
While riskier loan pools delivered more excess return as the loan market continued to rally, tail risk still needed to remain in check. Amherst Pierpont as developed measures of the weighted average discount margin of loans backing the different classes of a CLO, assuming in a liquidation event that better loans get sold first. The weighted average discount margin of loans backing CLO ‘BB’s has a negative correlation with recent excess returns (Exhibit 3), indicating that higher tail risk tended to reduce returns between July and September (Exhibit 4).
Exhibit 4: Nonlinearly negative relationship between recent CLO excess returns through September and ‘BB’ WADM percentile

Note: The weighted average discount margin (WADM) for a CLO ‘BB’ measures the average discount margin of the riskiest loans underlying a CLO, weighted by the balance of these loans. The excess returns refer to the deal performance between July and September.
Source: Amherst Pierpont Securities
A total of 43 managers delivered positive alpha in the market between July and September (Exhibit 5). The Top 5 included ZAIS, Marathon, Highland, Steele Creek and Jefferies Finance.
Exhibit 5: Alpha leaders in CLO portfolio performance July-September 2020

Note: Performance for managers with five or more deals tracked by APS. Performance attribution starts with calculated total return on the leveraged loan portfolio held in each CLO for the 3-month reporting period ending on the indicated date. CLOs, even with a single manager platform, may vary in reporting period. The analysis matches performance in each period to performance over the identical period in the S&P/LSTA Leveraged Loan Index. Where a deal has at least 18 months of performance history since pricing and no apparent errors in cash flow data, the analysis calculates a deal beta. The deal beta is multiplied by the index return to predict deal return attributable to broad market performance. Where no beta can be calculated, the analysis uses the average beta across each manager’s active deals weighted by the average deal principal balance over time. Any difference between performance attributable to beta and actual performance is attributed to manager alpha.
Source: Amherst Pierpont Securities.