Uncategorized
Loan performance in forbearance points to higher risk in FRESB
admin | October 2, 2020
This material is a Marketing Communication and does not constitute Independent Investment Research.
Forbearance in Freddie Mac K-series and small balance loan or FRESB programs has stabilized over the past few months with very few new loans entering forbearance, a reasonable percentage curing and most either remaining in forbearance or starting repayment. K-series loans have shown much stronger credit, with much lower forbearance rates and higher cure rates than FRESB. This early performance difference implies substantial differences in eventual losses, with an average projected FRESB deal loss nearly five times as high as K-series. This has the most consequence for mezzanine and subordinate debt investors.
Preliminary projections of credit losses range from 0% to 8% for both K-series and FRESB deals. However, the average projected loss across the 72 forbearance-impacted FRESB deals is 2.4%, while the average projected loss across 157 K-series deals is 0.5%. Moreover, only 4 K-series deals have projected losses above 3.0% of outstanding collateral.
Early difference in delinquencies
The K-series program continues to have stronger credit performance in this Covid environment than the small balance program. The K-series has lower percentage of loans that ever entered forbearance, 2.0% of FHMS loans versus 11.2% of FRESB loans (Exhibit 1). Overall, 2.8% of Freddie multifamily loans entered forbearance due to COVID-19. Loan balances in forbearance came disproportionately from student and healthcare properties in Freddie K-series.
Exhibit 1: Comparison of forbearance across FHMS and FRESB shelves
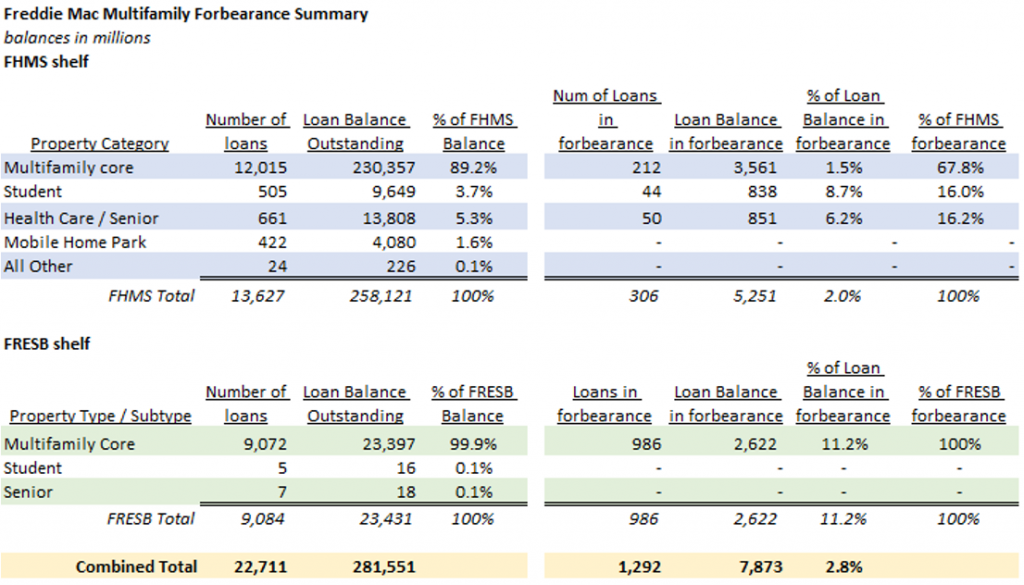
Note: Forbearance data as of 9/28/2020. Summary totals outstanding as of 9/28/2020.
Source: Bloomberg, Amherst Pierpont Securities
Note: Includes multifamily loans securitized on FHMS and FRESB shelves only. Total outstanding data as of 9/28/2020; forbearance data as of 9/28/2020.
Source: Bloomberg, Amherst Pierpont Securities
A larger percentage of K-series loans have either cured (8.9%) or are performing in forbearance (85.2%), compared to FRESB loans (6.4% cured and 78.7% performing, respectively). In fact, of the FRESB loans that entered forbearance at any time, 14.9% of those are currently in some stage of delinquency or default, though the bulk of them are one payment late. Of the loans that entered forbearance, only 5.8% of those in K-series are currently either in some stage of delinquency or default (Exhibit 2).
Exhibit 2: Comparison of payment status of FHMS and FRESB loans in forbearance
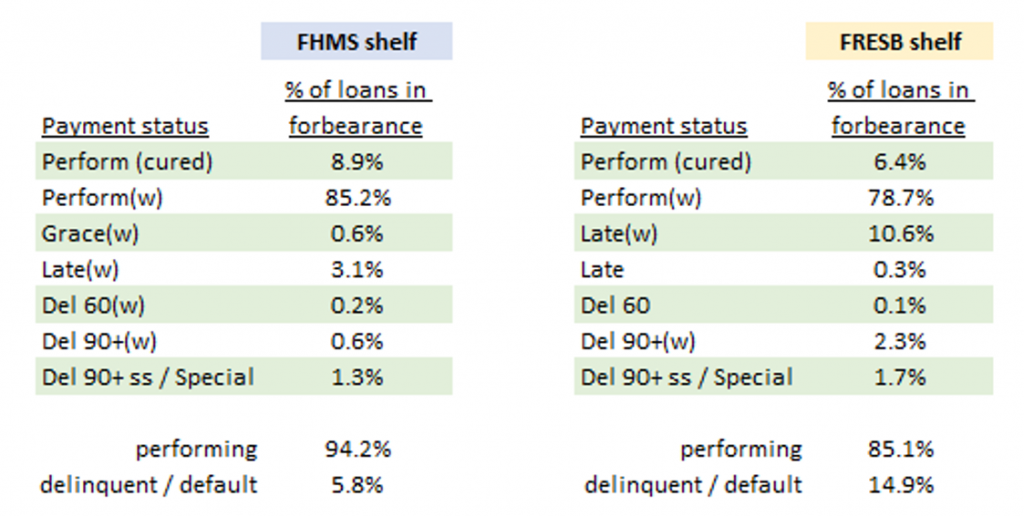
Note: This only includes loans in forbearance due to COVID-19. Payment status as of 9/28/2020 tape date. Source: Bloomberg, Amherst Pierpont Securities
Based on the stability in the forbearance data, it is possible to make preliminary estimates of potential credit losses in Freddie multifamily on a deal-by-deal basis. Because the two populations of loans have different forbearance profiles, the loss projections use separate sets of assumptions, though the methodology is the same.
K-series deals with the greatest projected losses are shown in Exhibit 3.
- Projected default rates are shown for each category of payment status (as of 9/28/2020). Loans that are not in forbearance and loans that have cured are assumed to have 0% default rates.
- Loans already in default or 90+ days delinquent have a 100% default rate. Loans that are still performing but in forbearance have a 20% probability of default.
- The assumed loss severity is 40%, compared to a historical average of 30%. Loss severities are expected to be higher for loans in forbearance due to the missed accrued payments, and loss severities rise generally in times of credit crisis.
- Projected losses = Sum of projected default rate * severity of loss * % of deal in that payment status bucket
Exhibit 3: Projected credit losses for COVID-impacted K-series deals
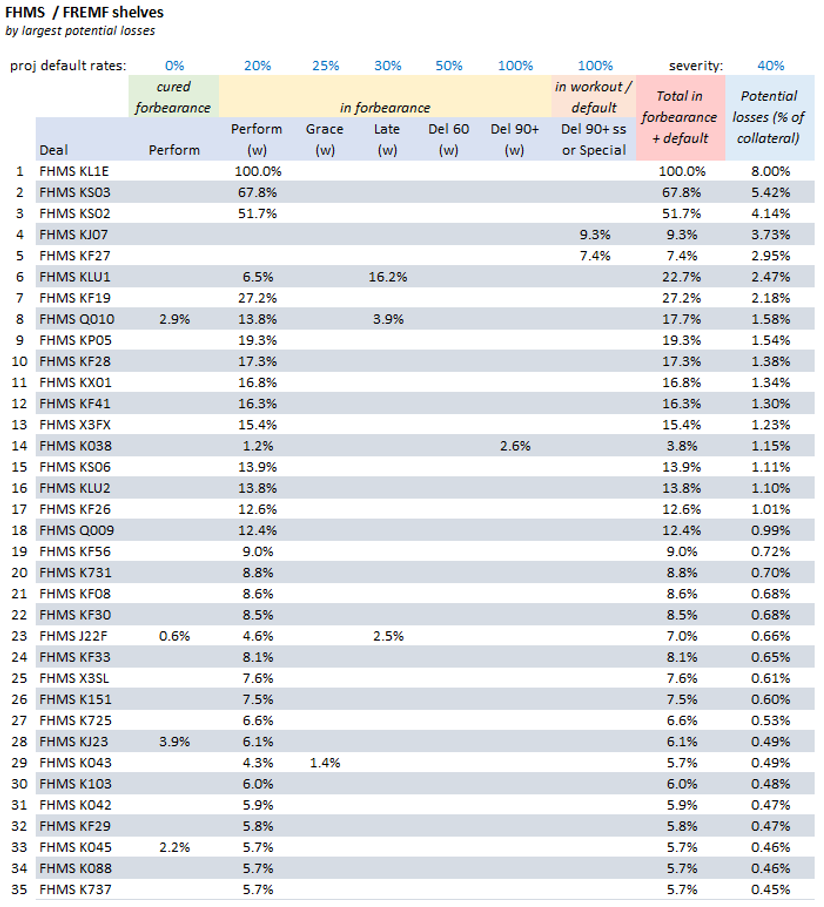
Source: Bloomberg, Amherst Pierpont Securities
It is worth pointing out that those Top 3 K-series deals with very high percentages of loans in forbearance are specialized large loan (KL) and seniors housing (KS) deals. The FHMS KL1E deal has a single loan, and that loan is in forbearance. The projected loss of 8% is irrelevant, as the actual loss will most likely either be 0% because the loan cures, or it will be equal to the loss severity rate of the loan if it defaults. The seniors housing deals can have portfolios of properties where the loans are taken out by the same borrower. In that circumstance, it is also likely that either none of the loans will default or all of them will. Specialized deal structures, in particular, require deeper analysis of the collateral.
Loss projections for FRESB deals (Exhibit 4) use higher default rates and loss severities due to their weaker performance so far.
Exhibit 4: Projected credit losses for COVID-impacted FRESB deals
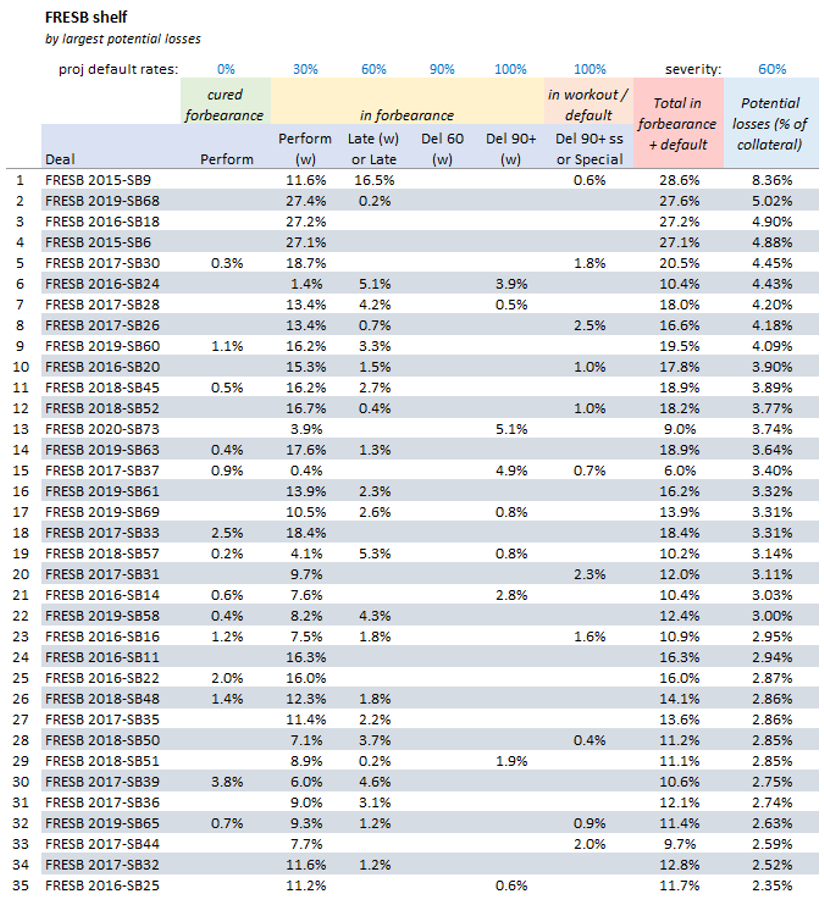
Source: Bloomberg, Amherst Pierpont Securities
The projected default rates for each status bucket and the loss severity rate used in this analysis are very conservative. Reasonable arguments exist for using default rates and loss severities that are significantly lower, which would result in lower projected credit losses across the deals.
This material is intended only for institutional investors and does not carry all of the independence and disclosure standards of retail debt research reports. In the preparation of this material, the author may have consulted or otherwise discussed the matters referenced herein with one or more of SCM’s trading desks, any of which may have accumulated or otherwise taken a position, long or short, in any of the financial instruments discussed in or related to this material. Further, SCM may act as a market maker or principal dealer and may have proprietary interests that differ or conflict with the recipient hereof, in connection with any financial instrument discussed in or related to this material.
This message, including any attachments or links contained herein, is subject to important disclaimers, conditions, and disclosures regarding Electronic Communications, which you can find at https://portfolio-strategy.apsec.com/sancap-disclaimers-and-disclosures.
Important Disclaimers
Copyright © 2026 Santander US Capital Markets LLC and its affiliates (“SCM”). All rights reserved. SCM is a member of FINRA and SIPC. This material is intended for limited distribution to institutions only and is not publicly available. Any unauthorized use or disclosure is prohibited.
In making this material available, SCM (i) is not providing any advice to the recipient, including, without limitation, any advice as to investment, legal, accounting, tax and financial matters, (ii) is not acting as an advisor or fiduciary in respect of the recipient, (iii) is not making any predictions or projections and (iv) intends that any recipient to which SCM has provided this material is an “institutional investor” (as defined under applicable law and regulation, including FINRA Rule 4512 and that this material will not be disseminated, in whole or part, to any third party by the recipient.
The author of this material is an economist, desk strategist or trader. In the preparation of this material, the author may have consulted or otherwise discussed the matters referenced herein with one or more of SCM’s trading desks, any of which may have accumulated or otherwise taken a position, long or short, in any of the financial instruments discussed in or related to this material. Further, SCM or any of its affiliates may act as a market maker or principal dealer and may have proprietary interests that differ or conflict with the recipient hereof, in connection with any financial instrument discussed in or related to this material.
This material (i) has been prepared for information purposes only and does not constitute a solicitation or an offer to buy or sell any securities, related investments or other financial instruments, (ii) is neither research, a “research report” as commonly understood under the securities laws and regulations promulgated thereunder nor the product of a research department, (iii) or parts thereof may have been obtained from various sources, the reliability of which has not been verified and cannot be guaranteed by SCM, (iv) should not be reproduced or disclosed to any other person, without SCM’s prior consent and (v) is not intended for distribution in any jurisdiction in which its distribution would be prohibited.
In connection with this material, SCM (i) makes no representation or warranties as to the appropriateness or reliance for use in any transaction or as to the permissibility or legality of any financial instrument in any jurisdiction, (ii) believes the information in this material to be reliable, has not independently verified such information and makes no representation, express or implied, with regard to the accuracy or completeness of such information, (iii) accepts no responsibility or liability as to any reliance placed, or investment decision made, on the basis of such information by the recipient and (iv) does not undertake, and disclaims any duty to undertake, to update or to revise the information contained in this material.
Unless otherwise stated, the views, opinions, forecasts, valuations, or estimates contained in this material are those solely of the author, as of the date of publication of this material, and are subject to change without notice. The recipient of this material should make an independent evaluation of this information and make such other investigations as the recipient considers necessary (including obtaining independent financial advice), before transacting in any financial market or instrument discussed in or related to this material.
Important disclaimers for clients in the EU and UK
This publication has been prepared by Trading Desk Strategists within the Sales and Trading functions of Santander US Capital Markets LLC (“SanCap”), the US registered broker-dealer of Santander Corporate & Investment Banking. This communication is distributed in the EEA by Banco Santander S.A., a credit institution registered in Spain and authorised and regulated by the Bank of Spain and the CNMV. Any EEA recipient of this communication that would like to affect any transaction in any security or issuer discussed herein should do so with Banco Santander S.A. or any of its affiliates (together “Santander”). This communication has been distributed in the UK by Banco Santander, S.A.’s London branch, authorised by the Bank of Spain and subject to regulatory oversight on certain matters by the Financial Conduct Authority (FCA) and the Prudential Regulation Authority (PRA).
The publication is intended for exclusive use for Professional Clients and Eligible Counterparties as defined by MiFID II and is not intended for use by retail customers or for any persons or entities in any jurisdictions or country where such distribution or use would be contrary to local law or regulation.
This material is not a product of Santander´s Research Team and does not constitute independent investment research. This is a marketing communication and may contain ¨investment recommendations¨ as defined by the Market Abuse Regulation 596/2014 ("MAR"). This publication has not been prepared in accordance with legal requirements designed to promote the independence of research and is not subject to any prohibition on dealing ahead of the dissemination of investment research. The author, date and time of the production of this publication are as indicated herein.
This publication does not constitute investment advice and may not be relied upon to form an investment decision, nor should it be construed as any offer to sell or issue or invitation to purchase, acquire or subscribe for any instruments referred herein. The publication has been prepared in good faith and based on information Santander considers reliable as of the date of publication, but Santander does not guarantee or represent, express or implied, that such information is accurate or complete. All estimates, forecasts and opinions are current as at the date of this publication and are subject to change without notice. Unless otherwise indicated, Santander does not intend to update this publication. The views and commentary in this publication may not be objective or independent of the interests of the Trading and Sales functions of Santander, who may be active participants in the markets, investments or strategies referred to herein and/or may receive compensation from investment banking and non-investment banking services from entities mentioned herein. Santander may trade as principal, make a market or hold positions in instruments (or related derivatives) and/or hold financial interest in entities discussed herein. Santander may provide market commentary or trading strategies to other clients or engage in transactions which may differ from views expressed herein. Santander may have acted upon the contents of this publication prior to you having received it.
This publication is intended for the exclusive use of the recipient and must not be reproduced, redistributed or transmitted, in whole or in part, without Santander’s consent. The recipient agrees to keep confidential at all times information contained herein.


