Uncategorized
Sell 30-year 2.0% pass-throughs, buy 15-year 2.0%
admin | September 25, 2020
This document is intended for institutional investors and is not subject to all of the independence and disclosure standards applicable to debt research reports prepared for retail investors. This material does not constitute research.
Par 30-year MBS continues to tighten to 15-year MBS, opening the door to trading out of 30-year 2.0% pass-throughs and into 15-year 2.0% pass-throughs with a net gain in carry and convexity.
On the tight end of the spread range
Nominal 30-year spreads now trail 15-year by only 22 bp while, in OAS, par 30-year MBS trades 13 bp tighter (Exhibit 1). For context, the nominal 30-to-15-year gap has traded wider than 22 bp in more than 85% of sessions in the last five years with the OAS gap running wider in 95% of sessions. The gap between the sectors is on the tight end of the 5-year range.
Exhibit 1
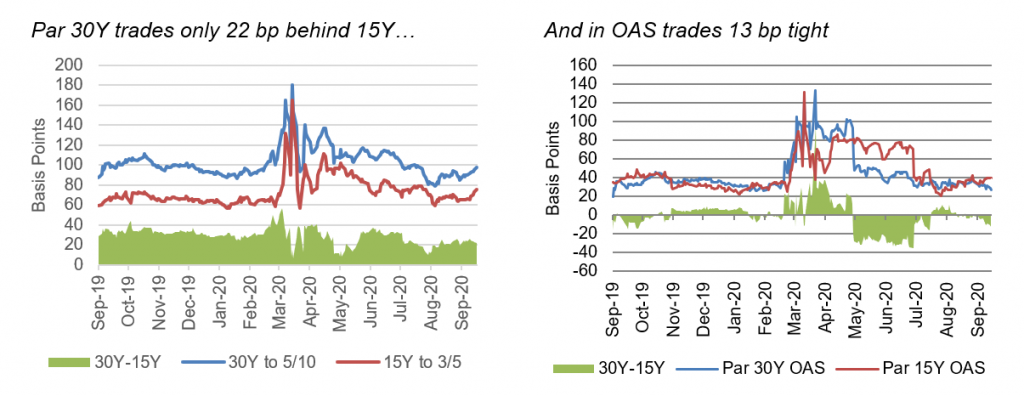
Source: Bloomberg as of 9/22/20, Amherst Pierpont Securities
Better convexity in 15-year MBS
Tight OAS with wide nominal spreads partly reflects greater negative convexity in 30-year MBS. The longer paper tends to show more cash flow volatility (Exhibit 2). Primary mortgage rates on 15-year loans often come in below the rates on 30-year, helping lift speeds on 15-year MBS in markets with limited refinancing. But 15-year pass-throughs historically trail 30-year paper in refinancing, even with similar refinancing incentives. The greater negative convexity in 30-year paper contributes to greater option cost.
Exhibit 2: More cash flow volatility in 30- than in 15-year MBS

Source: eMBS, Amherst Pierpont Securities
More option cost in 30-year MBS
Tight OAS with wide nominal spread also partly reflects a steep vol curve—a market that expects more yield volatility in longer than shorter rates, and 30-year MBS is more sensitive to those more volatile longer rates. For example, 5-year rates currently have implied yield volatility of 41.4 bp over the next year while 10-year rates have 61.4 bp (Exhibit 3). In other words, 30-year MBS has higher option cost.
Exhibit 3: A steep vol curve means more option cost for 30- than 15-year MBS
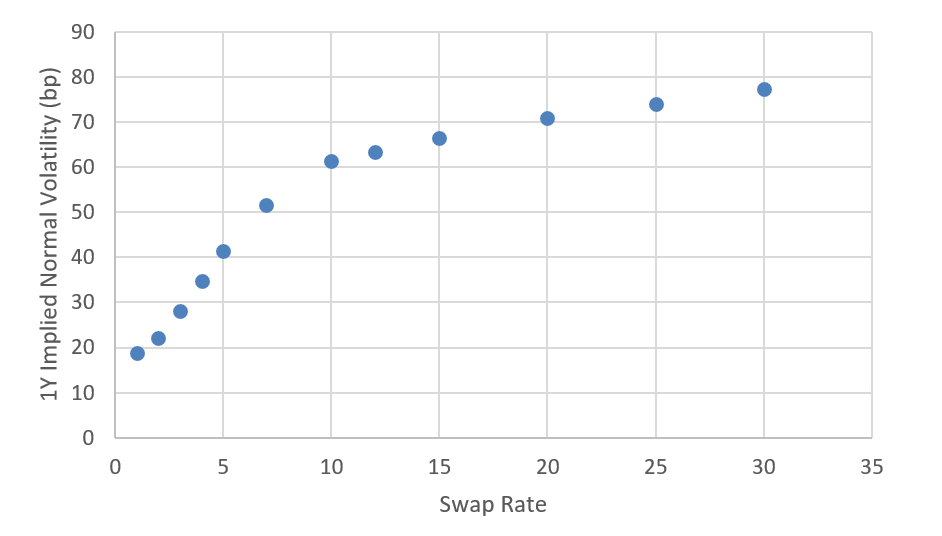
Note: Data show annual volatility in basis points implied by 1-year options on 1-year forward swap rates as of 9/22/20.
Source: Bloomberg, Amherst Pierpont Securities
Finding a way to position 15-year MBS with net positive carry
Special dollar rolls in 30- and 15-year MBS complicate the job of reallocating into 15-year MBS. The dollar roll is special in 30-year 1.5% through 3.0% coupons and in 15-year 1.5% and 2.0% coupons.
One place to consider reallocating is out of 30-year 2.0% pools and into 15-year 2.0%. The longer duration of the 30-year paper would allow an investor to add substantially more par exposure in the same 15-year coupon (Exhibit 4). For example, the TBA 30-year 2.0% dollar duration of 4.81 is 180% of the TBA 15-year dollar duration of 2.67. An investor could sell $100 million of the 30-year paper and buy $180 million of the 15-year paper and have the same dollar duration. And with the dollar rolls in each coupon, the larger 15-year position would have better absolute carry. That gives an investor a duration-neutral position in 15-year MBS with better carry and better convexity.
Exhibit 4: Comparing 30- and 15-year MBS risk and carry

Note: All market levels as of Sep 23 market open.
Source: Amherst Pierpont Securities
This material is intended only for institutional investors and does not carry all of the independence and disclosure standards of retail debt research reports. In the preparation of this material, the author may have consulted or otherwise discussed the matters referenced herein with one or more of SCM’s trading desks, any of which may have accumulated or otherwise taken a position, long or short, in any of the financial instruments discussed in or related to this material. Further, SCM may act as a market maker or principal dealer and may have proprietary interests that differ or conflict with the recipient hereof, in connection with any financial instrument discussed in or related to this material.
This message, including any attachments or links contained herein, is subject to important disclaimers, conditions, and disclosures regarding Electronic Communications, which you can find at https://portfolio-strategy.apsec.com/sancap-disclaimers-and-disclosures.
Important Disclaimers
Copyright © 2024 Santander US Capital Markets LLC and its affiliates (“SCM”). All rights reserved. SCM is a member of FINRA and SIPC. This material is intended for limited distribution to institutions only and is not publicly available. Any unauthorized use or disclosure is prohibited.
In making this material available, SCM (i) is not providing any advice to the recipient, including, without limitation, any advice as to investment, legal, accounting, tax and financial matters, (ii) is not acting as an advisor or fiduciary in respect of the recipient, (iii) is not making any predictions or projections and (iv) intends that any recipient to which SCM has provided this material is an “institutional investor” (as defined under applicable law and regulation, including FINRA Rule 4512 and that this material will not be disseminated, in whole or part, to any third party by the recipient.
The author of this material is an economist, desk strategist or trader. In the preparation of this material, the author may have consulted or otherwise discussed the matters referenced herein with one or more of SCM’s trading desks, any of which may have accumulated or otherwise taken a position, long or short, in any of the financial instruments discussed in or related to this material. Further, SCM or any of its affiliates may act as a market maker or principal dealer and may have proprietary interests that differ or conflict with the recipient hereof, in connection with any financial instrument discussed in or related to this material.
This material (i) has been prepared for information purposes only and does not constitute a solicitation or an offer to buy or sell any securities, related investments or other financial instruments, (ii) is neither research, a “research report” as commonly understood under the securities laws and regulations promulgated thereunder nor the product of a research department, (iii) or parts thereof may have been obtained from various sources, the reliability of which has not been verified and cannot be guaranteed by SCM, (iv) should not be reproduced or disclosed to any other person, without SCM’s prior consent and (v) is not intended for distribution in any jurisdiction in which its distribution would be prohibited.
In connection with this material, SCM (i) makes no representation or warranties as to the appropriateness or reliance for use in any transaction or as to the permissibility or legality of any financial instrument in any jurisdiction, (ii) believes the information in this material to be reliable, has not independently verified such information and makes no representation, express or implied, with regard to the accuracy or completeness of such information, (iii) accepts no responsibility or liability as to any reliance placed, or investment decision made, on the basis of such information by the recipient and (iv) does not undertake, and disclaims any duty to undertake, to update or to revise the information contained in this material.
Unless otherwise stated, the views, opinions, forecasts, valuations, or estimates contained in this material are those solely of the author, as of the date of publication of this material, and are subject to change without notice. The recipient of this material should make an independent evaluation of this information and make such other investigations as the recipient considers necessary (including obtaining independent financial advice), before transacting in any financial market or instrument discussed in or related to this material.


