Uncategorized
Quietly collecting principal forbearance in legacy RMBS
admin | September 25, 2020
This material is a Marketing Communication and does not constitute Independent Investment Research.
While the market has focused keenly on new forbearance across various forms of mortgage credit, holders of legacy RMBS have quietly continued to benefit from recovery of earlier forborne principal. Generally robust housing fundamentals and low mark-to-market LTV ratios on the overwhelming majority of legacy loans should provide a strong tailwind to sustained forbearance recoveries, which in turn should provide an attractive source of potential return for mortgage credit investors. Investors can get concentrated exposure to forbearance recoveries in both existing outstanding legacy mezzanine bonds as well as bonds previously been written off but still eligible to receive forbearance principal.
The opportunity for investors to recover forborne principal in the legacy market is sizable. There is nearly $32 billion in outstanding forbearance reported on loans in legacy RMBS trusts as well as an estimated $15 billion in potentially unreported forbearance, according to Amherst Pierpont calculations. And while strong housing fundamentals and low mark-to-market LTVs should help forbearance recoveries across the legacy universe, those recoveries can be idiosyncratic. As such, an analysis of historical forbearance recoveries across the legacy universe should point to the securitization shelves better positioned than others for higher future recoveries.
Forbearance recoveries: they’re still a thing
As delinquency rates across various forms of mortgage credit began to spike in the spring, investors began to discount options on forbearance recoveries embedded in legacy RMBS trusts. Somewhat surprisingly, the spike in delinquency rates provided little, if any, deterrent to forbearance recoveries. Over the past six months, legacy RMBS trusts have recovered an average of $48 million a month in reported forbearance, 17% more than the average monthly recovery over the past two years. Recoveries of unreported forbearance have been consistent over the past six months as well. Recovery rates on both reported and unreported forbearance have been consistent with longer term trends as well. Recovery rates on reported forbearance over the past six months have averaged 63% of the forborne amount, in-line with the two year average recovery rate of 62%. Unreported forbearance recoveries in the form of reversals of prior losses have averaged 7.9%, consistent with the two-year average of 8.7% (Exhibit 1)
Exhibit 1: Tracking monthly forbearance recoveries
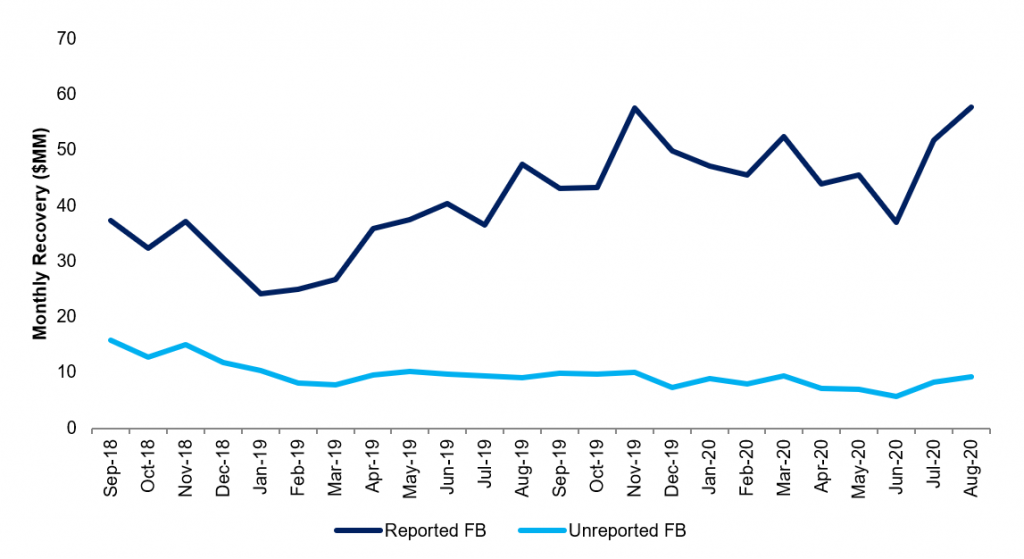
Source: Amherst Insight Labs, Amherst Pierpont
Tracking recent recoveries
Looking at forbearance recoveries over the past six months across both reported and unreported forbearance, certain shelves have exhibited higher nominal and percentage recoveries than others. Looking first at total recoveries of reported forbearance since the start of the pandemic shows the CWALT shelf has exhibited the highest nominal recoveries of any legacy shelf, returning just over $14 million in forborne principal, representing 75% of the reported forbearance amount on loans that abated from CWALT trusts over the period. Of shelves that returned a meaningful amount of forbearance over the past six months, the AHMA shelf had the highest recovery rate, recovering 99% of reported forbearance of loans that abated during the period. In terms of reversals of outstanding losses, or unreported forbearance, the LBMLT shelf has recovered roughly $2.6 million since March, representing roughly 30% of outstanding losses on loans that prepaid or liquidated from the shelf since then. The CHASE and ARSI shelves had the highest percentage recoveries on outstanding losses at 41.8% and 40.7% respectively. (Exhibit 2)
Exhibit 2: Stacking up recent forbearance recoveries by shelf
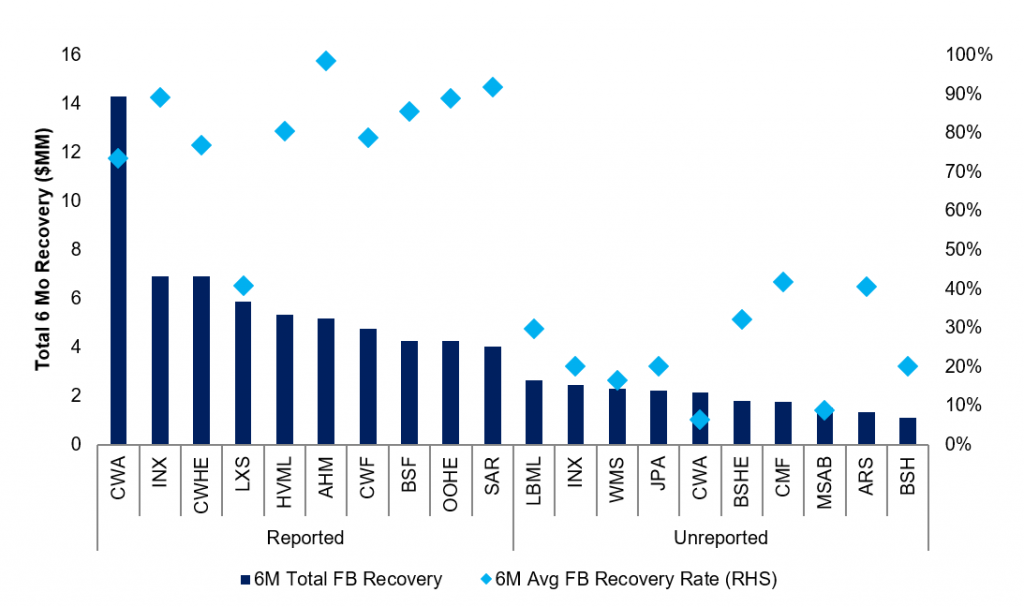
Source: Amherst Insight Labs, Amherst Pierpont
Longer term trends
Longer term trends are generally broadly consistent with near term ones as Countrywide shelves generally exhibit both high nominal recoveries of reported forbearance as well as generally favorable percentage recoveries. The CWALT shelf has seen over $50 million in recoveries on reported forbearance over the past two years with recovery rates averaging just over 80% of total forborne amounts on loans that have abated over the observation period. Recovery rates across the CWL and CWHL were 74.9% and 84.1% respectively. Of shelves with larger nominal recoveries, the ACE and AHMA shelves had the highest percentage recoveries of reported forbearance while the LXS shelf had the lowest, recovering just 37.2% of reported forbearance on loans that abated from LXS trusts over the past two years. With respect to unreported forbearance, the INDX shelf has exhibited the largest nominal recovery of past losses, totaling just over $23 million, representing over one third of losses previously allocated to loans that left these pools. Unreported forbearance recoveries as a percentage of past losses were some of the highest on the INDX shelf, along with the ARSI and BSABS shelves which returned 37.2% and 34.6% respectively. (Exhibit 3)
Exhibit 3: Analyzing longer term forbearance recoveries
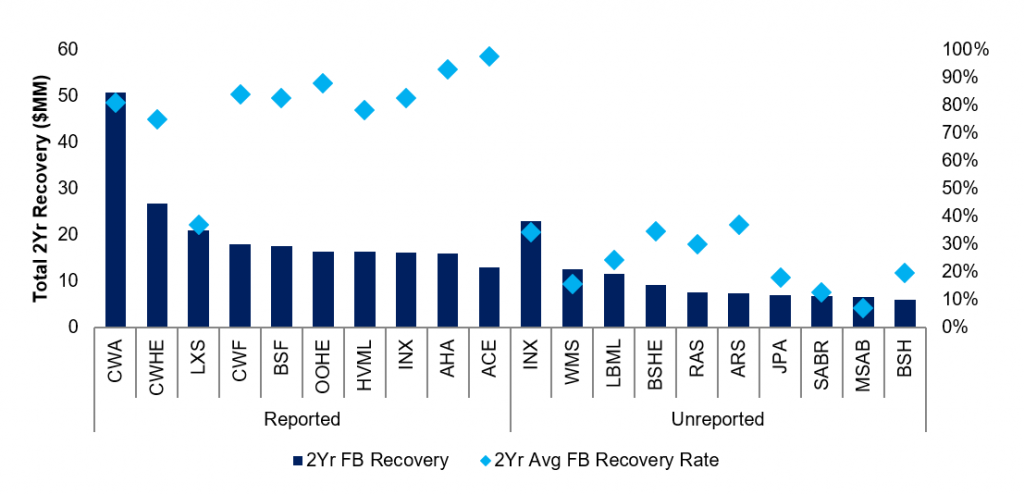
Source: Amherst Insight Labs, Amherst Pierpont
Gaining exposure to forbearance
Investors can gain concentrated exposure to forbearance recoveries in a number of ways. One common expression of the trade is through exposure to outstanding legacy mezzanine bonds that have levered upside to forbearance recoveries. Another form of exposure to forbearance recoveries is by owning ‘zero factor’ legacy subordinate bonds which have been written down but have optionality to receive principal associated with future forbearance recoveries. However, purchasing zero factor subordinates may be challenging for some investors in that the bonds offer no current carry but trade with significant rate duration due to not only the principal only nature of forbearance but the fact that these bonds can additionally be written up as a result of excess spread between the coupon rates on loans versus the liability spreads on bonds issued by the trust. And as rates rise, the value of zero factor bonds will be adversely impacted by both the decline in excess spread as liability coupons rise but the declining value of the forborne principal at higher discount rates. Hedging this interest will generate negative carry for holders of zero factor bonds. However, the trade offers somewhat of an implicit hedge in that principal generated from excess spread is implicitly a ‘low for long’ view on a slower economic recovery, while higher principal forbearance recoveries would likely be commensurate with a more robust economy and rising home values.
This material is intended only for institutional investors and does not carry all of the independence and disclosure standards of retail debt research reports. In the preparation of this material, the author may have consulted or otherwise discussed the matters referenced herein with one or more of SCM’s trading desks, any of which may have accumulated or otherwise taken a position, long or short, in any of the financial instruments discussed in or related to this material. Further, SCM may act as a market maker or principal dealer and may have proprietary interests that differ or conflict with the recipient hereof, in connection with any financial instrument discussed in or related to this material.
This message, including any attachments or links contained herein, is subject to important disclaimers, conditions, and disclosures regarding Electronic Communications, which you can find at https://portfolio-strategy.apsec.com/sancap-disclaimers-and-disclosures.
Important Disclaimers
Copyright © 2026 Santander US Capital Markets LLC and its affiliates (“SCM”). All rights reserved. SCM is a member of FINRA and SIPC. This material is intended for limited distribution to institutions only and is not publicly available. Any unauthorized use or disclosure is prohibited.
In making this material available, SCM (i) is not providing any advice to the recipient, including, without limitation, any advice as to investment, legal, accounting, tax and financial matters, (ii) is not acting as an advisor or fiduciary in respect of the recipient, (iii) is not making any predictions or projections and (iv) intends that any recipient to which SCM has provided this material is an “institutional investor” (as defined under applicable law and regulation, including FINRA Rule 4512 and that this material will not be disseminated, in whole or part, to any third party by the recipient.
The author of this material is an economist, desk strategist or trader. In the preparation of this material, the author may have consulted or otherwise discussed the matters referenced herein with one or more of SCM’s trading desks, any of which may have accumulated or otherwise taken a position, long or short, in any of the financial instruments discussed in or related to this material. Further, SCM or any of its affiliates may act as a market maker or principal dealer and may have proprietary interests that differ or conflict with the recipient hereof, in connection with any financial instrument discussed in or related to this material.
This material (i) has been prepared for information purposes only and does not constitute a solicitation or an offer to buy or sell any securities, related investments or other financial instruments, (ii) is neither research, a “research report” as commonly understood under the securities laws and regulations promulgated thereunder nor the product of a research department, (iii) or parts thereof may have been obtained from various sources, the reliability of which has not been verified and cannot be guaranteed by SCM, (iv) should not be reproduced or disclosed to any other person, without SCM’s prior consent and (v) is not intended for distribution in any jurisdiction in which its distribution would be prohibited.
In connection with this material, SCM (i) makes no representation or warranties as to the appropriateness or reliance for use in any transaction or as to the permissibility or legality of any financial instrument in any jurisdiction, (ii) believes the information in this material to be reliable, has not independently verified such information and makes no representation, express or implied, with regard to the accuracy or completeness of such information, (iii) accepts no responsibility or liability as to any reliance placed, or investment decision made, on the basis of such information by the recipient and (iv) does not undertake, and disclaims any duty to undertake, to update or to revise the information contained in this material.
Unless otherwise stated, the views, opinions, forecasts, valuations, or estimates contained in this material are those solely of the author, as of the date of publication of this material, and are subject to change without notice. The recipient of this material should make an independent evaluation of this information and make such other investigations as the recipient considers necessary (including obtaining independent financial advice), before transacting in any financial market or instrument discussed in or related to this material.
Important disclaimers for clients in the EU and UK
This publication has been prepared by Trading Desk Strategists within the Sales and Trading functions of Santander US Capital Markets LLC (“SanCap”), the US registered broker-dealer of Santander Corporate & Investment Banking. This communication is distributed in the EEA by Banco Santander S.A., a credit institution registered in Spain and authorised and regulated by the Bank of Spain and the CNMV. Any EEA recipient of this communication that would like to affect any transaction in any security or issuer discussed herein should do so with Banco Santander S.A. or any of its affiliates (together “Santander”). This communication has been distributed in the UK by Banco Santander, S.A.’s London branch, authorised by the Bank of Spain and subject to regulatory oversight on certain matters by the Financial Conduct Authority (FCA) and the Prudential Regulation Authority (PRA).
The publication is intended for exclusive use for Professional Clients and Eligible Counterparties as defined by MiFID II and is not intended for use by retail customers or for any persons or entities in any jurisdictions or country where such distribution or use would be contrary to local law or regulation.
This material is not a product of Santander´s Research Team and does not constitute independent investment research. This is a marketing communication and may contain ¨investment recommendations¨ as defined by the Market Abuse Regulation 596/2014 ("MAR"). This publication has not been prepared in accordance with legal requirements designed to promote the independence of research and is not subject to any prohibition on dealing ahead of the dissemination of investment research. The author, date and time of the production of this publication are as indicated herein.
This publication does not constitute investment advice and may not be relied upon to form an investment decision, nor should it be construed as any offer to sell or issue or invitation to purchase, acquire or subscribe for any instruments referred herein. The publication has been prepared in good faith and based on information Santander considers reliable as of the date of publication, but Santander does not guarantee or represent, express or implied, that such information is accurate or complete. All estimates, forecasts and opinions are current as at the date of this publication and are subject to change without notice. Unless otherwise indicated, Santander does not intend to update this publication. The views and commentary in this publication may not be objective or independent of the interests of the Trading and Sales functions of Santander, who may be active participants in the markets, investments or strategies referred to herein and/or may receive compensation from investment banking and non-investment banking services from entities mentioned herein. Santander may trade as principal, make a market or hold positions in instruments (or related derivatives) and/or hold financial interest in entities discussed herein. Santander may provide market commentary or trading strategies to other clients or engage in transactions which may differ from views expressed herein. Santander may have acted upon the contents of this publication prior to you having received it.
This publication is intended for the exclusive use of the recipient and must not be reproduced, redistributed or transmitted, in whole or in part, without Santander’s consent. The recipient agrees to keep confidential at all times information contained herein.


