Uncategorized
Putting a price on potential Ginnie Mae buyouts
admin | September 25, 2020
This material is a Marketing Communication and does not constitute Independent Investment Research.
Ginnie Mae MBS have taken a beating throughout much of the summer, with prices falling and spreads widening relative to conventional MBS. The 3.0% and 3.5% coupons are currently trading at lower dollar prices than conventional, which is unusual territory for those coupons. A fear of buyouts is likely the underlying reason for this underperformance, but the bonds appear to be priced to the worst-case scenario—that 100% of delinquent loans are bought out on October 1. This seems unlikely and suggests that Ginnie pools are priced at too steep a discount to conventional pools.
Since the start of July, the Ginnie Mae TBA 3.0% coupon price has fallen nearly 30/32s more than the conventional TBA, and its OAS has widened 9 bp (Exhibit 1). The price of Ginie Mae TBA 3.5%s fell 22/32s more than the conventional TBA and its OAS widened roughly 32.5 bp. Asia was a heavy seller of Ginnie Mae MBS over this time, and one likely reason was to avoid exposure to further buyouts.
Exhibit 1: Ginnie Mae TBA has underperformed relative to conventional MBS
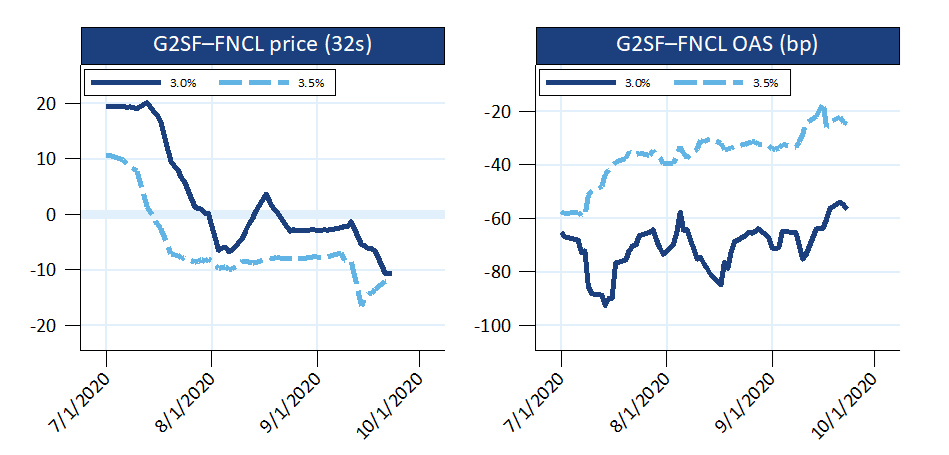
Source: Yield Book, Amherst Pierpont Securities
However, the large drop in the price of the Ginnie-to-Fannie swap and the current discount to conventional MBS both appear to much larger than the potential cost of Ginnie buyouts over conventional buyouts. Each conventional and Ginnie TBA from 3.0%s to 4.5%s was run through two scenarios at that TBA’s OAS (Exhibit 2). The first scenario excludes buyouts, while the second scenario includes buyouts.
Exhibit 2: The Ginnie discount to Fannie is typically larger than the price impact of buyouts
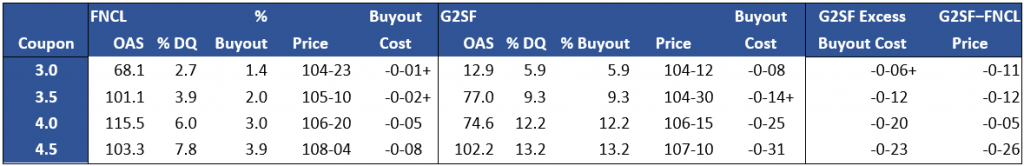
The cost of a buyout is calculated by calculating the OAS for each TBA, and then running each TBA though a scenario with a surge in buyouts. The difference in price is shown in the “buyout cost” column. The “% DQ” is the percentage of loans at least 60 days delinquent as of September 1. The “G2SF−FNCL Price” is the value of the Ginnie to Fannie swap. All valuations run as of 9/23.
Source: Yield Book, Amherst Pierpont Securities
The analysis assumes conventional buyouts occur in nine months and half of eligible loans cure, while the Ginnie buyouts happen immediately for all eligible loans. Loans that are at least 60-days delinquent are considered eligible for buyouts. This is an extreme scenario designed to maximize the cost of Ginnie buyouts and minimize the cost of conventional buyouts.
The difference between the cost of the Ginnie buyouts and conventional buyouts, shown in the column “G2SF Excess Buyout Cost”, is less than or equal to the current discount at which Ginnies trade to conventionals in the 3.0%, 3.5%, and 4.5% coupons. Put differently, if the “fair” price for Ginnies is flat to conventional, the current discount has built in a view that every delinquent Ginnie Mae loan will be bought out immediately. For example, the G2SF 3.0% currently trades 11/32s below FNCL 3.0%s, but buyouts on those pools should only hurt valuations by 6.5/32s.
However, the price difference is not likely to be this extreme. Non-bank Ginnie servicers have not been able to ramp up buyout efforts, which may indicate that it will be difficult to do so. They might find it better to allow loans to cure in a pool and earn income by attempting to refinance those loans later. Exhibit 3 shows the results of a few other buyout scenario. The first scenario replicates the results of Exhibit 2, while the second scenario also assumes 100% buyout rate but delays the buyouts by 6 months. The third and fourth scenarios assume 50% of loans cure.
Exhibit 3: The cost of buyouts drops significantly if half of delinquent loans cure
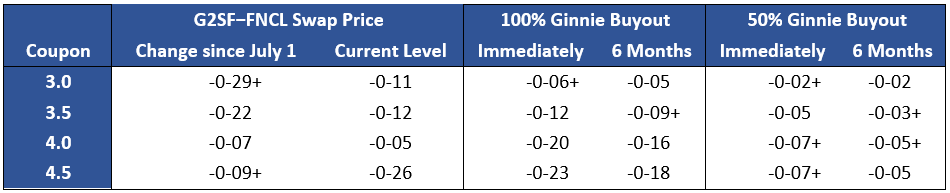
Source: Yield Book, Amherst Pierpont Securities
Delaying the buyouts by six months would improve the value of Ginnie Mae pools by roughly 2/32s to 5/32s, depending on the coupon. The benefit of lowering the buyout rate is much larger; in fact, cutting the buyout rate in half reduces the cost of buyouts by 4/32s to 16/32s, a larger than 50% improvement. And a 50% buyout rate coupled with a 6-month delay reduces the cost of Ginnie buyouts relative to conventional buyouts to only 2/32s to 5/32s. For most coupons, these buyout scenarios are less costly than the Ginnie discount to conventional pools and far less that the amount the price spread has fallen since the start of July. The 4.0% coupon is a little unusual—the coupon swap only fell 7/32s since July 1 and is only 5/32s below conventional.
This analysis does not consider the risk of a second wave of delinquencies, which would likely affect Ginnie Mae pools more than conventional pools.
Investors also can search for pools that have lower than average delinquency rates, which would have less buyout exposure. Seasoned vintages tend to have lower delinquency rates, as do new production pools. The worst delinquencies are typically in the 2017 through 2019 vintages. Pools issued by banks that have already bought out most of their delinquent loans, like Wells Fargo, can have very low delinquency rates and are likely only exposed to a second wave. Certain servicers’ borrowers have better than typical credit qualities so have lower delinquency rates and less exposure to buyout risk.
This material is intended only for institutional investors and does not carry all of the independence and disclosure standards of retail debt research reports. In the preparation of this material, the author may have consulted or otherwise discussed the matters referenced herein with one or more of SCM’s trading desks, any of which may have accumulated or otherwise taken a position, long or short, in any of the financial instruments discussed in or related to this material. Further, SCM may act as a market maker or principal dealer and may have proprietary interests that differ or conflict with the recipient hereof, in connection with any financial instrument discussed in or related to this material.
This message, including any attachments or links contained herein, is subject to important disclaimers, conditions, and disclosures regarding Electronic Communications, which you can find at https://portfolio-strategy.apsec.com/sancap-disclaimers-and-disclosures.
Important Disclaimers
Copyright © 2026 Santander US Capital Markets LLC and its affiliates (“SCM”). All rights reserved. SCM is a member of FINRA and SIPC. This material is intended for limited distribution to institutions only and is not publicly available. Any unauthorized use or disclosure is prohibited.
In making this material available, SCM (i) is not providing any advice to the recipient, including, without limitation, any advice as to investment, legal, accounting, tax and financial matters, (ii) is not acting as an advisor or fiduciary in respect of the recipient, (iii) is not making any predictions or projections and (iv) intends that any recipient to which SCM has provided this material is an “institutional investor” (as defined under applicable law and regulation, including FINRA Rule 4512 and that this material will not be disseminated, in whole or part, to any third party by the recipient.
The author of this material is an economist, desk strategist or trader. In the preparation of this material, the author may have consulted or otherwise discussed the matters referenced herein with one or more of SCM’s trading desks, any of which may have accumulated or otherwise taken a position, long or short, in any of the financial instruments discussed in or related to this material. Further, SCM or any of its affiliates may act as a market maker or principal dealer and may have proprietary interests that differ or conflict with the recipient hereof, in connection with any financial instrument discussed in or related to this material.
This material (i) has been prepared for information purposes only and does not constitute a solicitation or an offer to buy or sell any securities, related investments or other financial instruments, (ii) is neither research, a “research report” as commonly understood under the securities laws and regulations promulgated thereunder nor the product of a research department, (iii) or parts thereof may have been obtained from various sources, the reliability of which has not been verified and cannot be guaranteed by SCM, (iv) should not be reproduced or disclosed to any other person, without SCM’s prior consent and (v) is not intended for distribution in any jurisdiction in which its distribution would be prohibited.
In connection with this material, SCM (i) makes no representation or warranties as to the appropriateness or reliance for use in any transaction or as to the permissibility or legality of any financial instrument in any jurisdiction, (ii) believes the information in this material to be reliable, has not independently verified such information and makes no representation, express or implied, with regard to the accuracy or completeness of such information, (iii) accepts no responsibility or liability as to any reliance placed, or investment decision made, on the basis of such information by the recipient and (iv) does not undertake, and disclaims any duty to undertake, to update or to revise the information contained in this material.
Unless otherwise stated, the views, opinions, forecasts, valuations, or estimates contained in this material are those solely of the author, as of the date of publication of this material, and are subject to change without notice. The recipient of this material should make an independent evaluation of this information and make such other investigations as the recipient considers necessary (including obtaining independent financial advice), before transacting in any financial market or instrument discussed in or related to this material.
Important disclaimers for clients in the EU and UK
This publication has been prepared by Trading Desk Strategists within the Sales and Trading functions of Santander US Capital Markets LLC (“SanCap”), the US registered broker-dealer of Santander Corporate & Investment Banking. This communication is distributed in the EEA by Banco Santander S.A., a credit institution registered in Spain and authorised and regulated by the Bank of Spain and the CNMV. Any EEA recipient of this communication that would like to affect any transaction in any security or issuer discussed herein should do so with Banco Santander S.A. or any of its affiliates (together “Santander”). This communication has been distributed in the UK by Banco Santander, S.A.’s London branch, authorised by the Bank of Spain and subject to regulatory oversight on certain matters by the Financial Conduct Authority (FCA) and the Prudential Regulation Authority (PRA).
The publication is intended for exclusive use for Professional Clients and Eligible Counterparties as defined by MiFID II and is not intended for use by retail customers or for any persons or entities in any jurisdictions or country where such distribution or use would be contrary to local law or regulation.
This material is not a product of Santander´s Research Team and does not constitute independent investment research. This is a marketing communication and may contain ¨investment recommendations¨ as defined by the Market Abuse Regulation 596/2014 ("MAR"). This publication has not been prepared in accordance with legal requirements designed to promote the independence of research and is not subject to any prohibition on dealing ahead of the dissemination of investment research. The author, date and time of the production of this publication are as indicated herein.
This publication does not constitute investment advice and may not be relied upon to form an investment decision, nor should it be construed as any offer to sell or issue or invitation to purchase, acquire or subscribe for any instruments referred herein. The publication has been prepared in good faith and based on information Santander considers reliable as of the date of publication, but Santander does not guarantee or represent, express or implied, that such information is accurate or complete. All estimates, forecasts and opinions are current as at the date of this publication and are subject to change without notice. Unless otherwise indicated, Santander does not intend to update this publication. The views and commentary in this publication may not be objective or independent of the interests of the Trading and Sales functions of Santander, who may be active participants in the markets, investments or strategies referred to herein and/or may receive compensation from investment banking and non-investment banking services from entities mentioned herein. Santander may trade as principal, make a market or hold positions in instruments (or related derivatives) and/or hold financial interest in entities discussed herein. Santander may provide market commentary or trading strategies to other clients or engage in transactions which may differ from views expressed herein. Santander may have acted upon the contents of this publication prior to you having received it.
This publication is intended for the exclusive use of the recipient and must not be reproduced, redistributed or transmitted, in whole or in part, without Santander’s consent. The recipient agrees to keep confidential at all times information contained herein.


