Uncategorized
H&R Block issue offers attractive risk compensation for BBB investors
admin | September 25, 2020
This material is a Marketing Communication and does not constitute Independent Investment Research.
H&R Block’s (HRB) 10-year debt deal in August wound up pricing close to fair value, launching in the low 300s. The curve is fairly steep relative to the existing HRB 22s and 25s and the bonds still present good opportunity for investors with appetite for low BBB credit risk. Investors venturing out into low BBB credit should be properly compensated for it, and the step language in the structure affords some additional near-term cushion against possible downgrades into non-IG categories. The bottom-line for credit is that HRB has proven more resistant to trends into competing DIY tax filling products and alternative services than many investors had projected; and lost market share has been tapering off over the past several reporting seasons, particularly with changes in the tax code.
Issue details
HRB 3 ⅞ 08/15/30 @ ~305/10-year; G+307; 3.72%; $101.27
Issuer: Block Financial LLC (HRB)
Guaranteed by H&R Block Inc.
CUSIP: 093662AH7
Amount outstanding: $650 million
Ratings: Baa3/BBB
Coupon Step Language: +25 bp per downgrade below IG; capped at +200 bp
Global Deal
It is difficult to find suitable comps for HRB as they are a pretty unique issuer in the IG space. WU (Baa2/BBB) is included on the graphic as they are a decent proxy given similar questions about long term obsolescence due to newer technologies, and similar volatility over the past few years. Also included below are other BBB credits from the Discretionary Consumer Services segment in the IG Index where HRB is included, such as EXPE (Baa3/BBB-/BBB-), JD (Baa1/BBB) and INFO (Ba1/BBB-/BBB).
Exhibit 1. HRB vs Consumer Services Peers
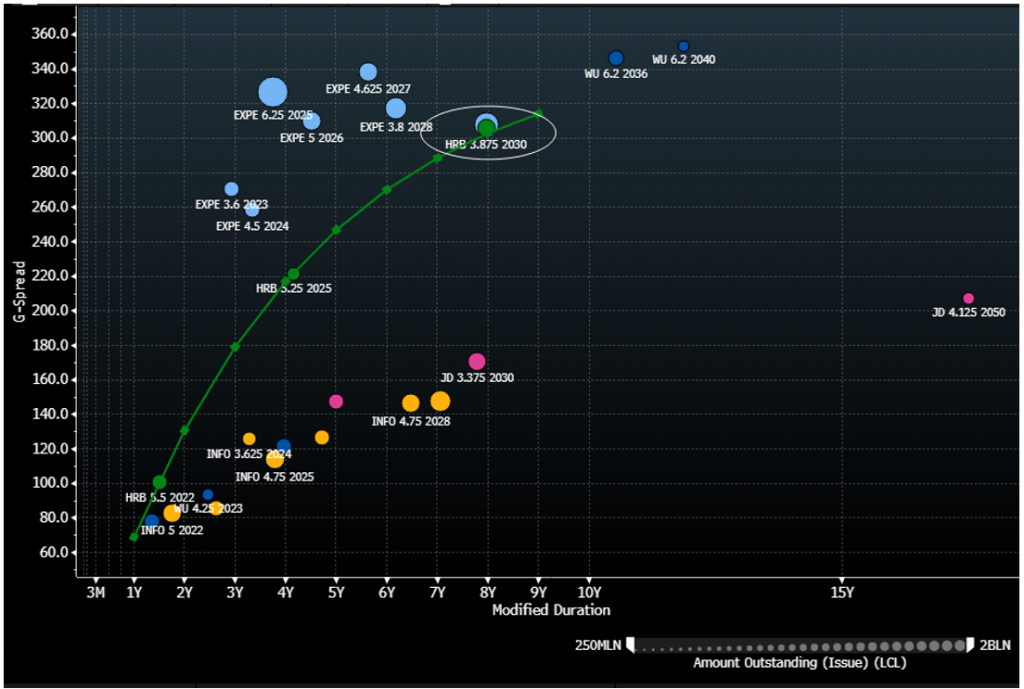
Source: Amherst Pierpont, Bloomberg/TRACE G-spread Indications
Credit perspective
- The debt launch significantly improved HRB’s liquidity profile. The issuance itself was widely anticipated, as they have a $650 million maturity in October of this year that had not yet been funded. Other maturities include $500 million in 2022, $350 million in 2025, and the $2 bn of their loan facility outstanding through 2023, versus the $750 million facility that still remains available. HRB currently has $2.6 billion in cash on the balance sheet after drawing down their entire credit facility versus $4.0 billion in total debt outstanding. We wouldn’t rule out additional debt launches in the intermediate term, which management could use to pay down the credit facility and further shore up their liquidity profile while the demand for credit risk remains firm in the public debt markets.
- While the notes are protected against downgrades to non-IG categories via the step language, given the highly seasonal nature of the business model, the rating agencies are likely to hold off on further rating actions until the end of next year’s fiscal calendar, when HRB reports 4Q21 results at the conclusion of next year’s tax season (4/30/21). It is difficult to make that determination during HRB’s off quarters when very little of the annual cash flows are actually generated.
- HRB concluded F2020 with elevated leverage in the high 4x range as a result of the delayed tax filing season through mid-July 2020. As a result, cash flow was pushed forward to 1Q21 that would typically be a part of the fiscal year-end results. The rating agencies will be monitoring for HRB to return to its more normal run-rate of below 2x leverage in order to sustain ratings in the IG categories.
- It was difficult to garner too much from the previous two quarter’s earnings results given the unique scenario created by the tax deadline delay. Total revenue in F1Q increased +300% to $601 million, which helped offset the -22% dip in F4Q20 revenue to $1.8 bn. F1Q adjusted EPS from continuing operations was $0.55/sh versus the $0.34 consensus estimate, as HRB reported pretax earnings of $124 million versus a pretax loss of $207 million in the prior year. F4Q20 EPS from continuing operations was $2.39 vs $4.32 in the prior year period, falling well short of the consensus estimate. Total Revenue for F2020 dropped -15% from the prior year.
This material is intended only for institutional investors and does not carry all of the independence and disclosure standards of retail debt research reports. In the preparation of this material, the author may have consulted or otherwise discussed the matters referenced herein with one or more of SCM’s trading desks, any of which may have accumulated or otherwise taken a position, long or short, in any of the financial instruments discussed in or related to this material. Further, SCM may act as a market maker or principal dealer and may have proprietary interests that differ or conflict with the recipient hereof, in connection with any financial instrument discussed in or related to this material.
This message, including any attachments or links contained herein, is subject to important disclaimers, conditions, and disclosures regarding Electronic Communications, which you can find at https://portfolio-strategy.apsec.com/sancap-disclaimers-and-disclosures.
Important Disclaimers
Copyright © 2026 Santander US Capital Markets LLC and its affiliates (“SCM”). All rights reserved. SCM is a member of FINRA and SIPC. This material is intended for limited distribution to institutions only and is not publicly available. Any unauthorized use or disclosure is prohibited.
In making this material available, SCM (i) is not providing any advice to the recipient, including, without limitation, any advice as to investment, legal, accounting, tax and financial matters, (ii) is not acting as an advisor or fiduciary in respect of the recipient, (iii) is not making any predictions or projections and (iv) intends that any recipient to which SCM has provided this material is an “institutional investor” (as defined under applicable law and regulation, including FINRA Rule 4512 and that this material will not be disseminated, in whole or part, to any third party by the recipient.
The author of this material is an economist, desk strategist or trader. In the preparation of this material, the author may have consulted or otherwise discussed the matters referenced herein with one or more of SCM’s trading desks, any of which may have accumulated or otherwise taken a position, long or short, in any of the financial instruments discussed in or related to this material. Further, SCM or any of its affiliates may act as a market maker or principal dealer and may have proprietary interests that differ or conflict with the recipient hereof, in connection with any financial instrument discussed in or related to this material.
This material (i) has been prepared for information purposes only and does not constitute a solicitation or an offer to buy or sell any securities, related investments or other financial instruments, (ii) is neither research, a “research report” as commonly understood under the securities laws and regulations promulgated thereunder nor the product of a research department, (iii) or parts thereof may have been obtained from various sources, the reliability of which has not been verified and cannot be guaranteed by SCM, (iv) should not be reproduced or disclosed to any other person, without SCM’s prior consent and (v) is not intended for distribution in any jurisdiction in which its distribution would be prohibited.
In connection with this material, SCM (i) makes no representation or warranties as to the appropriateness or reliance for use in any transaction or as to the permissibility or legality of any financial instrument in any jurisdiction, (ii) believes the information in this material to be reliable, has not independently verified such information and makes no representation, express or implied, with regard to the accuracy or completeness of such information, (iii) accepts no responsibility or liability as to any reliance placed, or investment decision made, on the basis of such information by the recipient and (iv) does not undertake, and disclaims any duty to undertake, to update or to revise the information contained in this material.
Unless otherwise stated, the views, opinions, forecasts, valuations, or estimates contained in this material are those solely of the author, as of the date of publication of this material, and are subject to change without notice. The recipient of this material should make an independent evaluation of this information and make such other investigations as the recipient considers necessary (including obtaining independent financial advice), before transacting in any financial market or instrument discussed in or related to this material.
Important disclaimers for clients in the EU and UK
This publication has been prepared by Trading Desk Strategists within the Sales and Trading functions of Santander US Capital Markets LLC (“SanCap”), the US registered broker-dealer of Santander Corporate & Investment Banking. This communication is distributed in the EEA by Banco Santander S.A., a credit institution registered in Spain and authorised and regulated by the Bank of Spain and the CNMV. Any EEA recipient of this communication that would like to affect any transaction in any security or issuer discussed herein should do so with Banco Santander S.A. or any of its affiliates (together “Santander”). This communication has been distributed in the UK by Banco Santander, S.A.’s London branch, authorised by the Bank of Spain and subject to regulatory oversight on certain matters by the Financial Conduct Authority (FCA) and the Prudential Regulation Authority (PRA).
The publication is intended for exclusive use for Professional Clients and Eligible Counterparties as defined by MiFID II and is not intended for use by retail customers or for any persons or entities in any jurisdictions or country where such distribution or use would be contrary to local law or regulation.
This material is not a product of Santander´s Research Team and does not constitute independent investment research. This is a marketing communication and may contain ¨investment recommendations¨ as defined by the Market Abuse Regulation 596/2014 ("MAR"). This publication has not been prepared in accordance with legal requirements designed to promote the independence of research and is not subject to any prohibition on dealing ahead of the dissemination of investment research. The author, date and time of the production of this publication are as indicated herein.
This publication does not constitute investment advice and may not be relied upon to form an investment decision, nor should it be construed as any offer to sell or issue or invitation to purchase, acquire or subscribe for any instruments referred herein. The publication has been prepared in good faith and based on information Santander considers reliable as of the date of publication, but Santander does not guarantee or represent, express or implied, that such information is accurate or complete. All estimates, forecasts and opinions are current as at the date of this publication and are subject to change without notice. Unless otherwise indicated, Santander does not intend to update this publication. The views and commentary in this publication may not be objective or independent of the interests of the Trading and Sales functions of Santander, who may be active participants in the markets, investments or strategies referred to herein and/or may receive compensation from investment banking and non-investment banking services from entities mentioned herein. Santander may trade as principal, make a market or hold positions in instruments (or related derivatives) and/or hold financial interest in entities discussed herein. Santander may provide market commentary or trading strategies to other clients or engage in transactions which may differ from views expressed herein. Santander may have acted upon the contents of this publication prior to you having received it.
This publication is intended for the exclusive use of the recipient and must not be reproduced, redistributed or transmitted, in whole or in part, without Santander’s consent. The recipient agrees to keep confidential at all times information contained herein.


