


Uncategorized
Accelerating prepayments in agency CMBS creates RV in project loan IO
admin | September 24, 2020
This material is a Marketing Communication and does not constitute Independent Investment Research.
Historically there has been little focus on prepayments in agency CMBS. Fannie and Freddie multifamily loans typically include either yield maintenance or defeasance provisions, so voluntary prepayments have little impact on most investors, with agency IO and inverse IO investors being a significant exception. Involuntary prepayments, or defaults, have been low, though they can be a drag on performance of very high dollar price bonds when they occur. However, voluntary prepayments in Ginnie Mae project loans are quite material to both principal pay and IO class investors, and these prepayments are accelerating. The IO classes of recent vintage Ginnie Mae project loans are especially attractive, as they accrue the prepayment premiums that accompany low rates and fast speeds.
Ginnie Mae project loans normally have a declining points system for prepayment protection, where the borrower pays X “points” or X% of the outstanding loan balance as a penalty to prepay the loan. The prepayment penalty declines over time, typically from 10 points to 1 point of premium in yearly, 1 point increments, and after 10 years there is zero prepayment penalty. These penalties usually accrue to the IO investors, though in some cases P&I bonds can receive them too. As the prepayment penalty declines, the loans generally prepay faster, all else being equal. Given the significant rally in rates, Ginnie Mae project loans have experienced an acceleration in prepays over the last several months, with prepayment speeds of loans with 5 to 10 points of penalty exceeding historical averages.
Summary of prepayment dynamics
- Prepayments in Ginnie Mae project loans slowed a bit in August (Exhibit 1), but on a 3-month rolling average basis they continue to accelerate in most vintages (Exhibit 2). Prepayment speeds in the 2018 vintage, whose loans still have on average 8 penalty points attached, are nearly as fast as speeds of the 2013 vintage, whose loans have on average only a 3% penalty premium.
Exhibit 1: Prepayment speeds (1m CPR) Exhibit 2: Prepayment speeds (3m CRR) of select
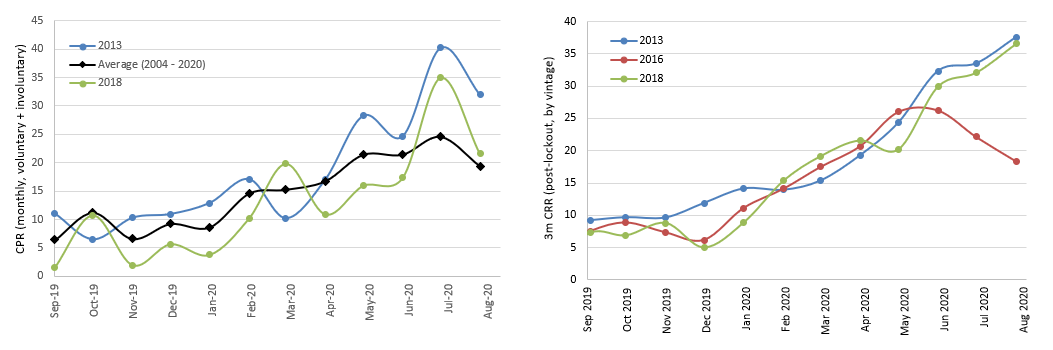
Note: CPR includes both voluntary and involuntary prepayments. CRR is voluntary prepayments only. Source: Intex, Amherst Pierpont Securities
- The 2016 vintage, which on average has 6 points of penalty required to prepay, is showing some signs of burnout as its 3-month CPR has fallen steadily from 26.3 in May to 18.4 in August.
- This is consistent when considering the historical average CPR based on penalty points. There is a significant acceleration in prepayment speeds from CRR of 12.3 to CRR of 20.8 as the penalty points decline from 6 to 5 (Exhibit 3). Over the past year given the substantial drop in rates, prepayment speeds have been higher than the historical average for loans with prepayment penalties of 5 to 10 points, but loans with prepay penalties from 0 to 4 points have been mostly prepaying somewhat slower than average. These are older loans and are likely also exhibiting some signs of burnout.
Exhibit 3: Historical prepayment speeds (CRR) by penalty points
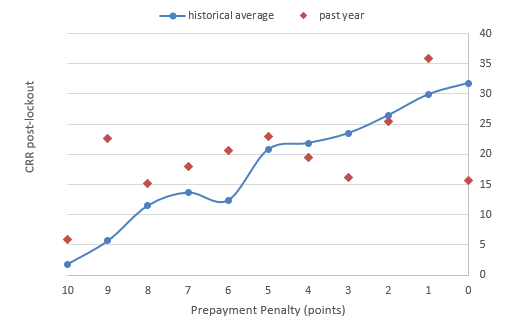
Source: Intex, Amherst Pierpont Securities
- However, there is also evidence that loans have been prepaying faster than average over the past year for most levels of refi incentive (Exhibit 4). Loans with up to 175 bp refi incentive have been prepaying faster than historical averages. Loans with refi incentives of 275 bp or above are paying much more slowly than historical averages, again likely indicating burnout – where the higher rates are due to the loans being considerably more seasoned – or a constraint on credit that would account for the higher rate.
Exhibit 4: Historical prepayment speeds (CRR) by refi incentive
Source: Intex, Amherst Pierpont Securities
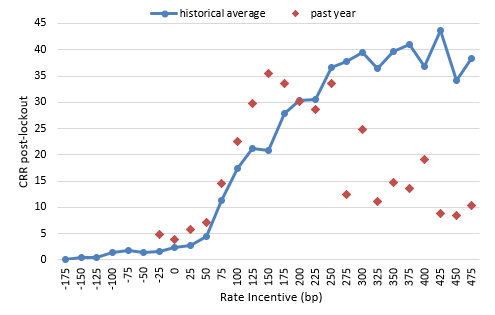
- Over 60% of outstanding Ginnie Mae project loans have coupons in the 3.00% – 4.00% bucket (Exhibit 5). That would give them roughly a 50 bp to 150 bp refinance incentive. Given that interest rates are expected to remain very low for several years, more of those loans will prepay as their prepayment penalties decline, with potentially the biggest jump in 2016 vintage loans.
Exhibit 5: Ginnie Mae project loans by vintage and coupon
Note: Defeased and prepaid loans are excluded. Source: Bloomberg, Amherst Pierpont Securities
Projecting performance of Ginnie Mae project loan IOs
The standard way to model a Ginnie Mae project loan pool is to use 15% CPJ: this means using the conventional project loan default curve for involuntary prepayments (Exhibit 6), and a flat 15% CPR for voluntary prepayments after lockout.
Exhibit 6: Ginnie Mae Project Loan Default Curve (100% PLD)
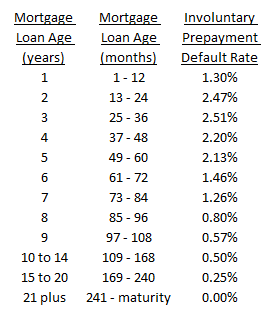
Note: For purposes of the PLD model, Mortgage Loan Age means the number of months elapsed since the issue date. Involuntary prepayments are assumed to start immediately. Source: Ginnie Mae, Amherst Pierpont Securities
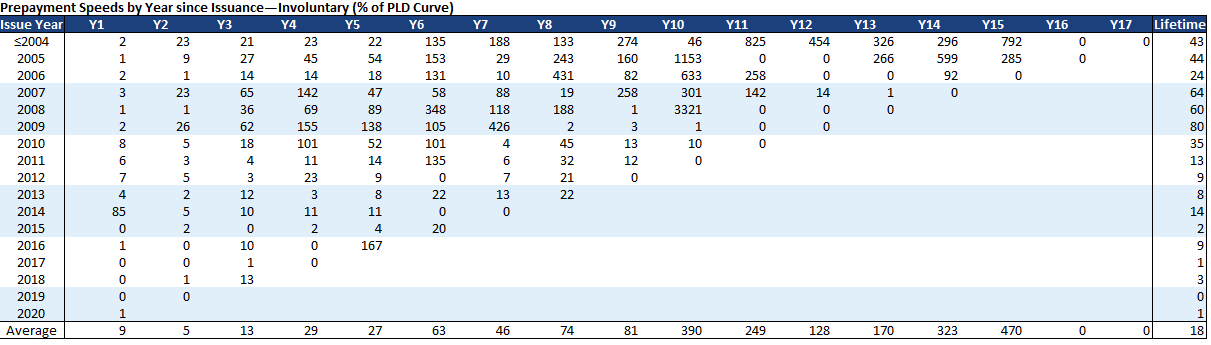
In recent years, involuntary prepayment rates for project loans have been considerably below 100% PLD both on an average basis and across most vintages (Exhibit 7). The lifetime involuntary prepayment rate for vintages with at least 10 years of maturity ranges from a low of 24% PLD for the 2004 vintage to a high of 80% PLD for the 2009 vintage. In any given year the involuntary prepayments can vary considerably, in some extreme cases reaching as high as 1000% to over 3000% of PLD – equivalent to default rates of 5% and 15% – for vintages 2005 and 2008 when the mortgage loan age was 10 years and there were relatively few loans left outstanding. On an average basis defaults have historically trended well below the PLD curve for the first 9 years, but have been higher than the 0.25% to 0.50% expected during years 10 through 15.
Exhibit 7: Historical involuntary prepayment speeds of Ginnie Mae project loans
Source: Intex, Amherst Pierpont Securities
Using 50% PLD is a good approximation over the lifetime of a project loan security based on historical involuntary prepayments, though the current crisis and levels of forbearance could arguably support conservatively assuming 100% to 150% PLD for performance projections.
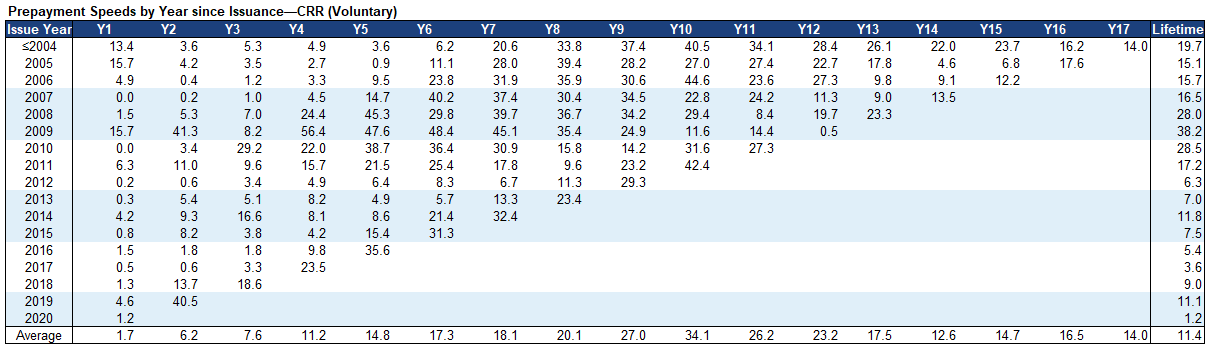
Lifetime voluntary prepayment speeds (CRR) across vintages with at least 10 years of maturity range from 15 CRR to 38 CRR (Exhibit 8). On a month to month basis these speeds vary considerably, and current 12-month speeds across vintages range from 10% CRR to 32% CRR. The highest speeds are in the 2010 to 2015 vintages, although the 2018 vintage has a 12-month CRR of 18.3% and the 2019 vintage, where the average prepayment penalty is still 8 to 9 points, is currently prepaying at 13% CPR.
Exhibit 8: Historical voluntary prepayment speeds of Ginnie Mae project loans
Source: Intex, Amherst Pierpont Securities
A good relative value opportunity is to buy recent vintage project loan IOs that can benefit from fast speeds while their prepayment penalties are high. Consider the GNR 2019-114 IO, which has a 2.75% yield at 15% CPJ (Exhibit 9). The graph on the left shows how the projected yield will rise if speeds are faster or slower than 15 CPR (with PLD held constant at 100%), and the graph on the right shows how the projected yield rises as involuntary defaults decrease (with CPR held constant at 15%).
Exhibit 9: GNR 2019-141 IO projected performance across scenarios
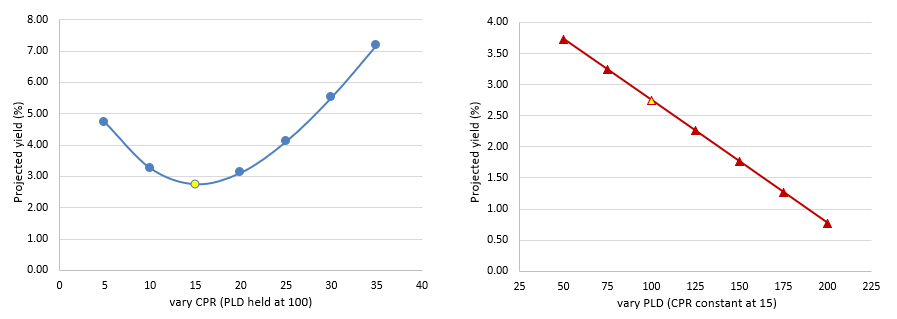
Note: All scenario analysis done on Bloomberg using BVAL pricing on 9/24/2020. Source: Bloomberg, Amherst Pierpont Securities
Prepayment speeds are never constant, of course, but an increase (or decrease) in speeds over the short term will raise projected yields even if speeds later fall back to “normal”. Higher defaults will certainly lower performance, as going from 100 PLD to 150 PLD will drop the projected yield from 2.75% to 1.75% at 15 CPR.
Prepayments impact Fed buying operations
By early September the Fed’s agency CMBS purchase operations had diminished to a trickle, with the Fed passing entirely on several operations and buying modest amounts in others. New issue spreads had tightened through pre-COVID levels and the Fed was likely left with the unenviable choice of either (1) buying high dollar price bonds, which can underperform if involuntary prepays pick up in the wake of forbearances; or (2) reaching through the market to buy bonds and tightening spreads even further. However, prepayments in agency CMBS have been accelerating, leaving the Fed with a lot of money that needed to be reinvested. For Treasury and agency MBS securities in the SOMA portfolio the Fed reinvests the run-off in the same product. That’s a bit tougher to do in agency CMBS, since the overall market is smaller and the secondary market isn’t terrifically deep.
The FOMC recently announced an adjustment to their agency CMBS purchase operations, stating that the amounts purchased will depend on the reasonableness of the prices offered, and that agency CMBS principal payments will no longer be invested. During the last two operations the Fed has bought over $100 million for the first time since late May. Given the speed of prepays it’s unclear if that will be enough to maintain the size of the agency CMBS portion of the portfolio, but the market is churning out new product which has taken some of the pressure off of spreads.