


Uncategorized
The myriad reasons models have missed speeds
admin | September 18, 2020
This material is a Marketing Communication and does not constitute Independent Investment Research.
Prepayment speeds have exceeded the expectations of forecasters and models through much of the pandemic. Ginnie Mae models have been more accurate than conventional models, however, suggesting they price Ginnie Mae prepayment risk more reliably in different interest rate environments. Ginnie Mae pools currently price low relative to conventional pools due to the risk of loan buyouts. But financing buyouts has proven difficult for non-bank servicers. Investors should consider that mass buyouts may never happen, which would mean that it would be worth allocating into Ginnie Mae MBS at today’s low dollar prices.
Models have been slow throughout the pandemic
Prepayment models have struggled to predict prepayment speeds throughout the pandemic. Many models missed the big increase in prepayments in March and have continued to underpredict speeds through August. It helps to look at the percent difference between the widely used Yield Book production model and actual prepayment speeds from March through August for 3.0%s through 4.5%s pass-throughs and for 2012 and newer vintages (Exhibit 1). This model was estimated prior to Covid, so model errors can provide a useful view of sectors facing heightened prepayment risk.
Yield Book’s conventional model was slow on almost every cohort, and the errors were generally largest on more seasoned vintages and lower coupons. Many cohorts were roughly 20% to 40% too slow. Errors of that size are large for a prepayment model, especially when sustained over six months. And Yield Book tends to be one of the faster prepayment models, suggesting that other models have faced even larger errors.
Exhibit 1: Fannie Mae 30-year model errors
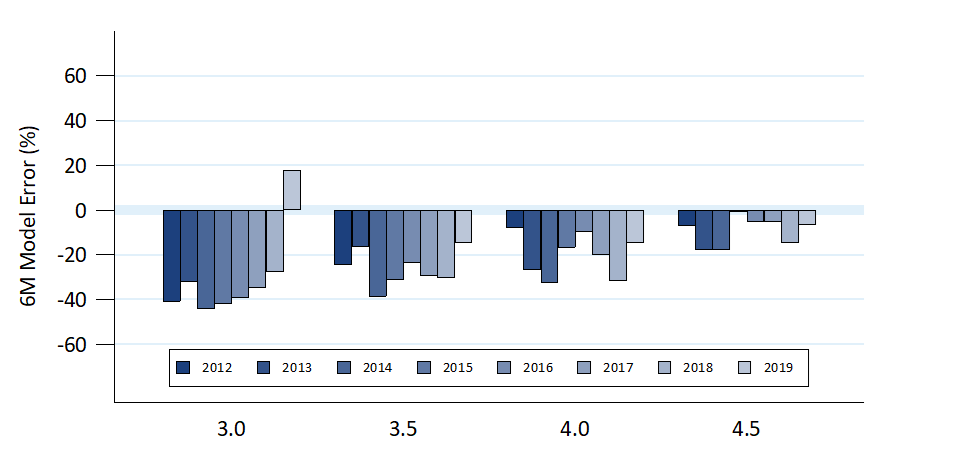
Note: Voluntary prepayments only; buyouts are excluded from model and actual.
Source: Yield Book, Amherst Pierpont Securities
Yield Book’s Ginnie Mae model fared better overall than the conventional model (Exhibit 2). The Ginnie Mae numbers include only voluntary prepayment speeds, since many Ginnie Mae pools were hit by massive buyouts of delinquent loans by bank servicers. Including the buyouts would make it impossible to draw conclusions about the model’s performance predicting borrower refinancing. The Ginnie Mae model also was slowest on lower coupons and seasoned vintages, but overpredicted speeds on many 4.0% and 4.5% cohorts.
Exhibit 2: Ginnie Mae II 30-year model errors
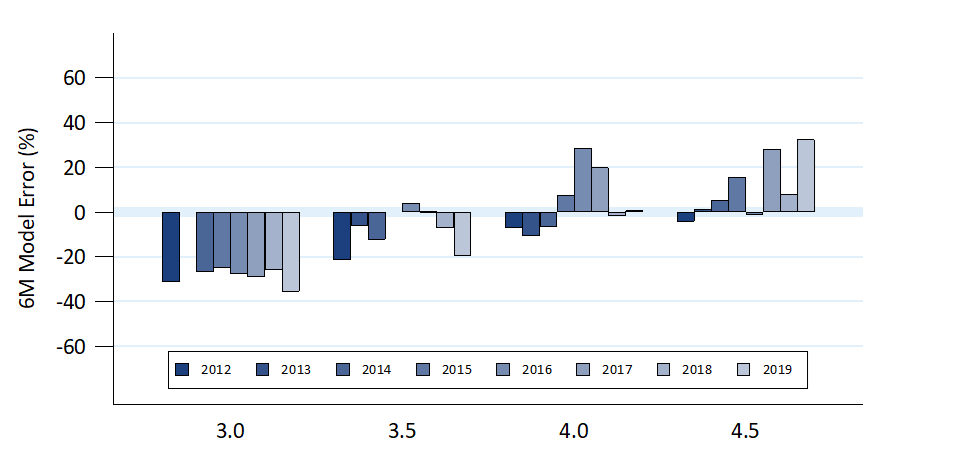
Note: Voluntary prepayments only; buyouts are excluded from model and actual.
Source: Yield Book, Amherst Pierpont Securities
The model was also slow on most conventional loan balance cohorts (Exhibit 3). In most coupons the errors tended to be a little smaller than the cohort’s errors on coupon vintage, and the difference was most extreme in the 3.0%s. The model tended to be the most accurate on the lowest balance pools—LLB, MLB, and HLB—and typically had the largest underprediction on Max $150k and Max $175k loans. The Ginnie Mae model (Exhibit 4) did quite well on 3.0% through 4.0% loan balance pools and was broadly fast on the 4.5%s.
Exhibit 3: Fannie Mae 30-year loan balance and jumbo model errors
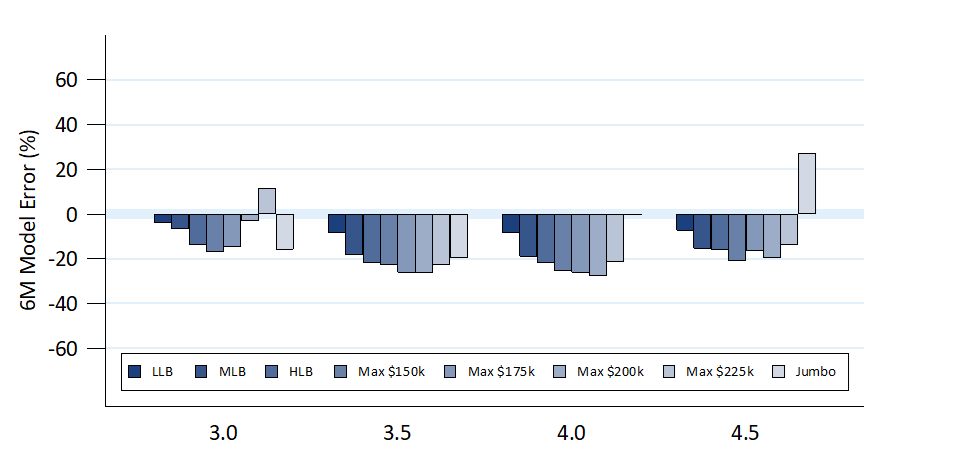
Note: Voluntary prepayments only; buyouts are excluded from model and actual.
Source: Yield Book, Amherst Pierpont Securities
Exhibit 4: Ginnie Mae II 30-year loan balance model errors
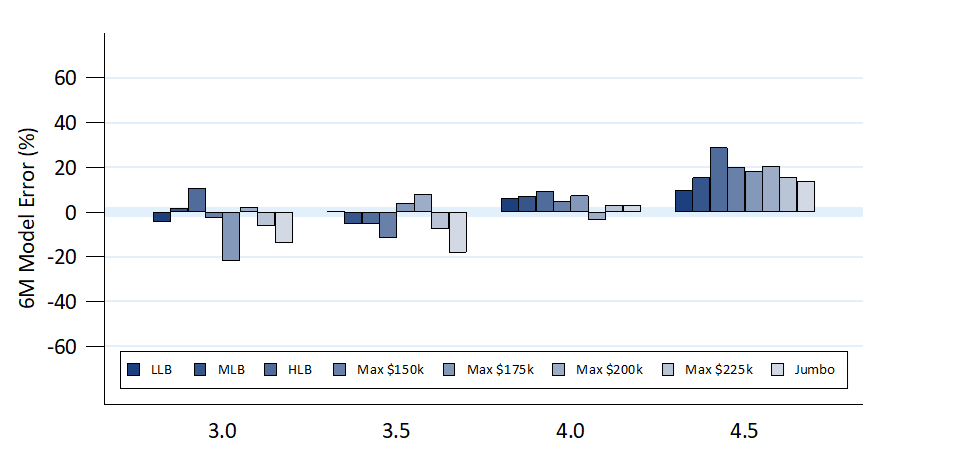
Note: Voluntary prepayments only; buyouts are excluded from model and actual.
Source: Yield Book, Amherst Pierpont Securities
The conventional model had mixed results on pools backed by New York, Florida, Texas, and Puerto Rico loans (Exhibit 5). It was slow across the stack on Texas pools and generally slow predicting New York speeds, but was generally fast on Puerto Rico pools and higher coupon Florida pools. The Ginnie Mae model was typically too fast for these pool types, including Texas pools (Exhibit 6). However, it did fare better predicting Puerto Rico prepayments.
Exhibit 5: Fannie Mae 30-year geo model errors
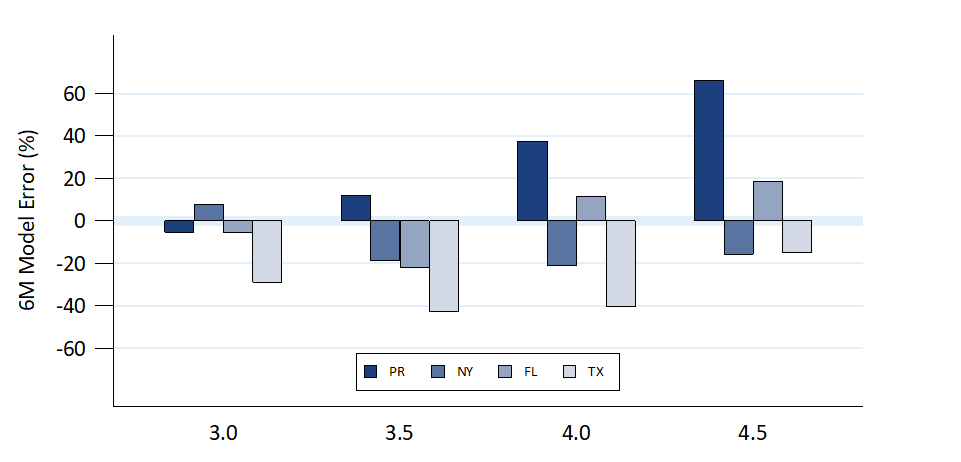
Note: Voluntary prepayments only; buyouts are excluded from model and actual.
Source: Yield Book, Amherst Pierpont Securities
Exhibit 6: Ginnie Mae II 30-year geo model errors
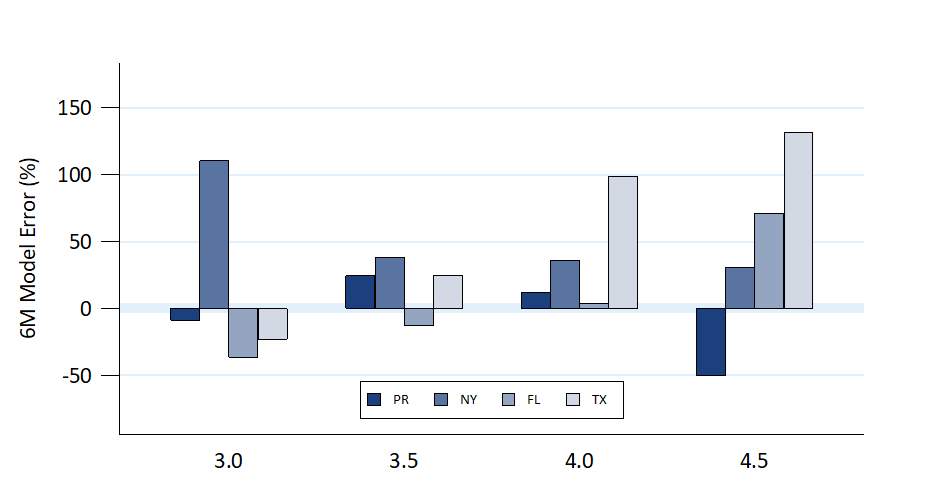
Note: Voluntary prepayments only; buyouts are excluded from model and actual.
Source: Yield Book, Amherst Pierpont Securities
Finally, the conventional model was generally a little slow on FICO and investor pools. The model fit best on investor pools >3%s and on FICO 3%s.
Exhibit 7: Fannie Mae 30-year FICO and 100% investor model errors
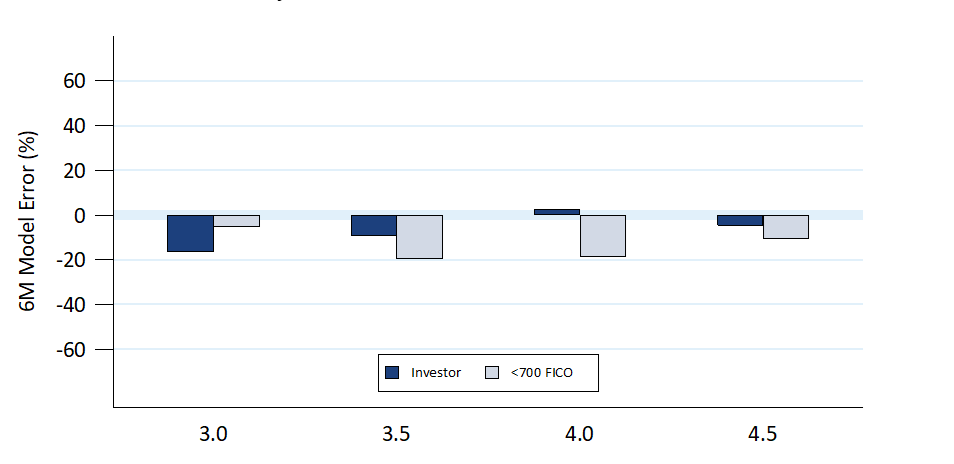
Source: Yield Book, Amherst Pierpont Securities
A variety of factors have contributed to slow prepayment projections
There is not a single factor that explains the difficulty models have had predicting speeds. Rather a few effects have likely combined to push prepayment speeds faster than models expected.
Surprisingly low mortgage rates
One issue is that borrowers are getting lower mortgage rates than models are predicting. Many models calibrate their mortgage rate to a source like Freddie Mac’s Primary Mortgage Market Survey rate. The survey typically tracks mortgage rates very closely (Exhibit 8). The exhibit compares the weighted average coupon on loans originated each month to the average of the survey rate in the month prior to origination (longer lags can be used with very similar results). The lagged survey rate is a proxy for the average rate used to lock loans that closed in the month. From January 2014 until February 2020, the difference averages slightly below 30 bp and rarely deviated by more than 10 bp. The only exception was a brief period at the end of 2016 following the presidential election. The survey is calibrated to a better-than-average credit borrower, so is expected to be lower than the average origination rate that also includes lower credit borrowers.
Since March, however, the difference has plummeted to roughly 5 bp to 10 bp. This means that a model using the survey rate to estimate prevailing mortgage rates is running rates that are 20 bp to 25 bp too high. This will have a significant effect on prepayment models, and especially on the most rate-sensitive coupons such as 30-year 3.0%s. This is consistent with the earlier data, which showed that the conventional and Ginnie Mae models were the slowest on the 3% coupon.
Exhibit 8: Mortgage rate surveys have become less accurate during the pandemic
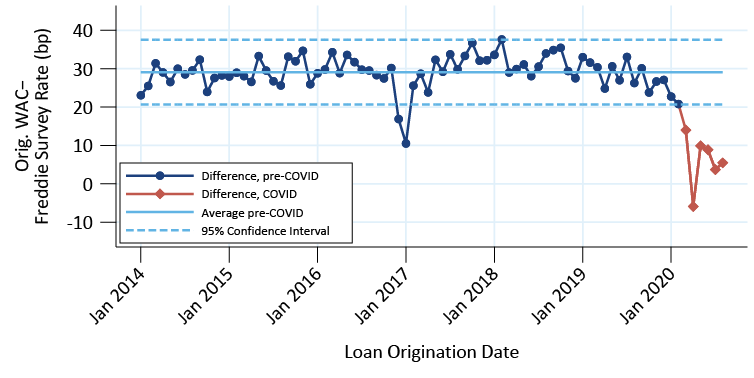
Note: Loans in 30-year Fannie pools issued from January 2014 through August 2020 were aggregated origination month to calculate a monthly average rate. The Freddie Mac survey rate was lagged 30 days, aggregated by month, and subtracted from the rate originated that month. A positive number means the average loan receives a higher rate than indicated by the survey.
Source: Fannie Mae, Freddie Mac, eMBS, Amherst Pierpont Securities
The media effect and PIWs
Another factor influencing prepayment speeds is the media effect, best seen by spike in the MBA Refinance Index in the first half of March. The industry was overwhelmed with applications, which extended timelines to close loans. This spread out the excess prepayments into at least May and June, contributing to fast speeds across cohorts. Lower loan balance loans are typically less exposed to this risk since borrowers do not save as much from refinancing and loan officers don’t make as much money closing those loans.
Finally, the increasing use of property inspection waivers (PIW) by the GSEs and new options for appraisals that do not require entry to the premises have contributed to faster prepayment speeds. This is likely one reason that the conventional model performed worse than the Ginnie Mae model, since most Ginnie Mae borrowers have had access to streamlined refis for many years. However, inspection waivers cannot explain all the conventional speed differences. For example, loans originated prior to 2014 are ineligible for Fannie Mae’s PIW program, which specifically needs an appraisal on-file that was taken in the last six years. Still, models underestimated speeds on these seasoned vintages.
Investment implications
The Ginnie Mae model has performed substantially better than the conventional model throughout the pandemic, which suggests that Ginnie Mae pools have less model risk than conventional pools. The Ginnie model also performed better across the coupon stack, which suggests it will do a better job of measuring prepayment risk across OAS paths. However, the risk of elevated buyouts in Ginnie Mae pools has suppressed prices, such that the G2SF 3.0%s and 3.5%s currently trade below Fannie Mae pools. Ginnie Mae pools are backed by the full faith and credit of the United States government and typically trade above conventional.
Ginnie Mae pools may prove to be a good investment if the buyouts do not materialize. Non-bank servicers have not yet secured financing to conduct widespread buyouts, showing that it is difficult to do. Eventually they will run out of time as borrowers exit forbearance and potentially cure and remain in the pool.
There are some ways to minimize the risk of Ginnie Mae buyouts. Some servicers’ have lower delinquencies and have not been actively buying out delinquent loans. Newly originated loans are less likely to accumulate significant delinquencies unless the economy suffers another downturn. And pools backed by the fast-buyout servicers should contain very few delinquent loans, and therefore are unlikely to have fast buyouts unless there is another wave.