


Uncategorized
Bank flows, dollar rolls and MBS derivatives
admin | September 11, 2020
This material is a Marketing Communication and does not constitute Independent Investment Research.
After the Fed, bank investment portfolios are having the biggest impact today on fixed income markets. A range of developments have put these portfolios under pressure to generate net interest income, but they operate with some significant constraints. Backed by billions of dollars of monthly investment flows, bank portfolios have contributed to distortions in some parts of the market. The MBS dollar roll and the MBS derivatives markets are notable examples.
Impact of bank flows on dollar rolls
Banks in August invested an estimated $122 billion in MBS. Around $72 billion came from reinvestment of amortization and prepayments, and around $50 billion came from net new exposure (Exhibit 1). Since banks rarely use the MBS dollar roll, most of their purchases come either as pass-throughs delivered at regular settlement or as CMOs, which take delivery of pools and restructure them for the investor. In either case, the bank or the CMO desk is taking the pools out of the floating supply available to settle TBA contracts. A smaller float usually encourages a special dollar roll, especially if strong demand for a pass-through coupon continues and trading desks become concerned about their ability to deliver pools to TBA buyers.
Exhibit 1: Sources of bank investment flow in August
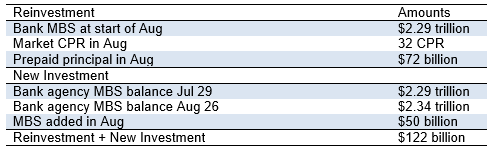
Source: Federal Reserve H.8., eMBS, Amherst Pierpont Securities
Pass-through closest to par have seen strong demand since March and have largely rolled special since then, routinely offering implied annualized financing rates for conventional 30-year 2.0%, 2.5% and 3.0% pass-throughs of between -50 bp and -100 bp. Fed demand for these pass-through coupons as part of QE has clearly contributed to both demand and the special financing, since the Fed also rarely uses the dollar roll. And bank reinvestment and new investment has contributed to demand for these coupons as well, and to a special dollar roll.
To put Fed and bank demand for MBS in context, their combined demand has outstripped net new MBS supply by more than $400 billion. Fed MBS balances this year through August are up $520 billion and bank balances are up $267 billion, nearly 13%, for a combined $787 billion. Net new MBS supply is up only $374 billion. In all likelihood, total return accounts are selling pools into the bid from the Fed and banks and are taking MBS exposure through the TBA dollar roll. But the special rolls signal that total return accounts are not selling enough to fully meet combined Fed and bank demand.
Fed demand for MBS will likely continue since QE looks like it is in its early stages, and bank demand for MBS will likely continue as investment portfolios remain under pressure to generate income. The spotlight on bank portfolios comes from rising loss reserves, weak loan demand and falling earnings. It also comes from demand for safe, liquid assets available in enough size to absorb hundreds of billions of reinvestment and new investment flows every month. The Treasury market could also absorb bank flows, and bank Treasury balances have jumped $218 billion this year, or nearly 24%. Cash investment could also absorb demand, and cash this year has jumped $1.1 trillion, or 63%. But neither Treasury debt nor cash add much to profitability. Agency MBS holdings look bound to grow aggressively at least through the first half of 2021 if not beyond. Investors able to take advantage of the dollar roll should build it into their expectation for the magnitude and duration of special rolls.
It is worth noting that the dynamic in dollar rolls could shift if more banks decided to use the dollar roll itself. For portfolios trying to squeeze more income out of safe, liquid assets, it seems like a natural solution. Current GAAP allow banks to use the dollar roll under specific circumstances and receive treatment for the roll as a financing rather than a buy-and-sell. That is an important difference. A financing treatment allows MBS carry to flow into net interest income while a buy-and-sell would create earnings volatility. A dollar roll treated as a financing also freezes amortization of price premium, which is currently a significant source of concern and earnings volatility in bank investment portfolios. However, few banks have worked out the details of dollar roll financing with their auditors. If this changes, more rolls and fewer TBA deliveries would soften dollar rolls.
Impact of bank flows on MBS derivatives
The other notable impact of bank flows has come in the market for MBS derivatives, not because banks are buying derivatives but because they are buying other securities that require creation of interest-only or inverse interest-only MBS. The securities in demand are CMO classes with coupons stripped down from the coupon on the underlying MBS pools. For example, a bank might decline to buy a 30-year 2.0% pass-through at $103 and instead buy a CMO class backed by those pass-throughs but with a coupon of 1.5% and a dollar price below $101.Anecdotally, more than 90% of fixed-rate CMOs issued for August settlement had a stripped-down coupon. Stripping a coupon requires creating an IO or IIO.
Securities close to par have particular value for banks because of rules for accounting for income on prepayable or callable bonds. On prepayable bonds purchased at a premium to par, the investor has to amortize the premium based on an initial assumption about prepayments and average life. If prepayments come in faster than the investor expects, which has generally been happening since March, the investor may have to adjust assumptions and accelerate premium amortization, hurting current earnings and generating earnings volatility.
Conversations throughout August with a wide range of banks suggest continuing high sensitivity to premium amortization and earnings volatility, presumably driving the high demand for stripped coupons and other ways of getting MBS toward par. Most liquid pass-through now trade well above par, and prepayments have proven difficult to model since March, further raising bank concerns about unexpected premium amortization. Since the demand for stripped coupons partly or even largely reflects their value for bank accounting rather than pure risk and return, some of the value of the underlying pass-throughs is likely transferred into the IO or IIO created in the process. Investors able to use IO or IIO in their portfolios should take a close look at that market.
Impact of bank flows in other areas
Banks have generally had less impact so far in other areas of fixed income. Holdings of Treasury debt have surged to $1.1 trillion, but that only represents 5% of the outstanding public market. Bank holdings in cash investments now stand at nearly $2.9 trillion, up $1.1 trillion so far this year, reflecting the impact of Fed QE and the aftereffects of the Paycheck Protection Program. As earnings pressure on banks increases, it is likely that some of these funds will migrate into loans or securities.
* * *
The view in rates
The Fed’s new framework for managing monetary policy—inflation averaging and efforts only to offset shortfalls in employment—should steepen the yield curve as the implications sink in in coming weeks and months. The Fed will likely only tighten if inflation shows up, not necessarily if unemployment runs too low. The new approach could see inflation run clearly above 2.0% and possibly above 2.5% for periods of time before the Fed might act to rein it in. That should pose the most uncertainty and most risk for longer maturities, push yields higher as the Fed holds the front of the yield curve down.
Rates in general have remained in roughly the same range since the end of March, although actual and implied rate volatility picked up slightly in August. The 10-year real rate has stayed around -100 bp for several weeks while the market holds onto its expectations of inflation with the spread between 10-year notes and TIPS implying inflation of 166 bp. Real rates still could drop further if the Fed this fall shows willingness to let inflation return to target and go higher, all the while holding nominal rates down.
The view in spreads
Spread compression took a holiday in August as spreads broadly moved sideways and interest rate and equity volatility picked up. The new volatility may reflect concerns about the failure of Congress so far to agree on new fiscal stimulus. Households and smaller business floated on that stimulus through July, although savings may sustain conditions for some a little longer. But it begins to create new risk. Fed QE should continue to tighten spreads, Risk assets remain caught between Fed buying on one hand and heavy net supply of Treasury debt on the other. There is still fundamental risk in the most leveraged corporate balance sheets with corporate leverage going up through 2020, and only there might spreads continue lagging the rest of the market.
As a side effect of the steeper Treasury curve, projected OAS in MBS should rise as should option-adjusted duration. A steeper curve presents prepayment models with rising rates, and with almost the entire MBS market trading at a premium, rising rates mean slower prepayments and better spreads.
The view in credit
Fundamental credit remains as uncertain as the economy, and the lack of new fiscal stimulus increases risk for households and small businesses. The downside in leveraged credit has outweighed the upside since March, and the imbalance without fiscal stimulus looks likely to get worse. Many investment grade companies have stockpiled enough cash to survive protracted slow growth, but highly leveraged companies and consumers are at risk. Prices on some sectors of leveraged loans, rating agency downgrades in leveraged loans and high yield and rising bank loan loss reserves signal a wave of distressed credit. Elevated unemployment and delinquency rates in assets from MBS to auto loans show pressure on the consumer balance sheet. A rebound in growth in the third quarter should help, but the US has only recouped half of jobs lost since February. The next half looks likely to be harder.