


Uncategorized
Valuing CRT through the lens of loss coverage
admin | August 21, 2020
This document is intended for institutional investors and is not subject to all of the independence and disclosure standards applicable to debt research reports prepared for retail investors. This material does not constitute research.
As the universe of Fannie Mae and Freddie Mac Credit Risk Transfer bonds continues to season and prepay, the risk profiles and spreads across different vintages and parts of the capital structure should continue to shift. Bonds’ relative sensitivity to absorbing forecasted losses can be a useful metric for normalizing risk across vintages and capital structure. Admittedly, ratings, structural leverage and convexity will all influence bond spreads, too. But based on ability to absorb projected loss, it appears that seasoned STACR high LTV M3s and B1s offer some of the best relative value.
In particular:
- Seasoned STACR high LTV M3s may offer some of the most attractive relative value given relatively wide nominal spreads, attractive loss coverage multiples and thicker slices of risk
- Seasoned high LTV B1s offer comparable loss coverage to later vintage M2s, and some trade at meaningful discounts where investors may get the additional benefit of pulling to par on elevated prepayment rates
While CRTs structures are largely homogeneous at issuance, bonds in these deals can exhibit different risk profiles over time as prepayments de-lever the capital structure. One metric that can be used to evaluate the credit risk embedded in a CRT bond, or any levered mortgage credit instrument, for that matter, is the ratio of a bonds’ credit enhancement to the expected loss on the pool of collateral, commonly referred to as a loss coverage multiple. For instance, if a bond’s credit support is only sufficient to withstand exactly the amount of expected loss for the collateral, it would have a loss coverage multiple of 1.0. All else equal bonds with similar loss coverage multiples should have roughly the same amount of credit risk. However, the multiple is a measurement of the bond’s exposure to its first dollar of loss. Therefore, thinner more structurally levered bonds will be riskier than thicker ones with the same amount of loss coverage and should trade at wider spreads. Given this, we take both loss coverage and thickness into account when establishing a framework for relative value.
Looking across the CRT universe of actual loss last cash flow and B1 bonds, loss coverage multiples vary from over 8 times expected losses for certain 2015 transactions to less than 1.0 for later vintage B1 classes with comparable disparities in structural leverage. Expected losses across deals after making certain Covid-19 related assumptions for delinquencies and foreclosure frequency range from roughly 25 bp to 85 bp. Higher expected losses are generally seen in later vintage low LTV groups or trusts while lower expected losses are generally associated with seasoning, home price appreciation and borrower deleveraging or deep mortgage insurance coverage on high LTV groups or deals which exhibit higher defaults but lower loss severities as a result of deep MI coverage.
Given uncertainty around the impact of the pandemic on future delinquencies and defaults, loss coverage may be very much a moving target. Therefore trying to extract relative value across vintages and capital structure may be easiest to do in thicker bonds whose performance will be less levered to small changes in assumptions. Mapping the universe of CRT M2/M3 and B1 classes by their expected loss coverage ratio and tranche thickness creates an initial framework for evaluating credit and capital structure risk across the universe of bonds. (Exhibit 1)
Exhibit 1: Mapping loss coverage across the CRT universe
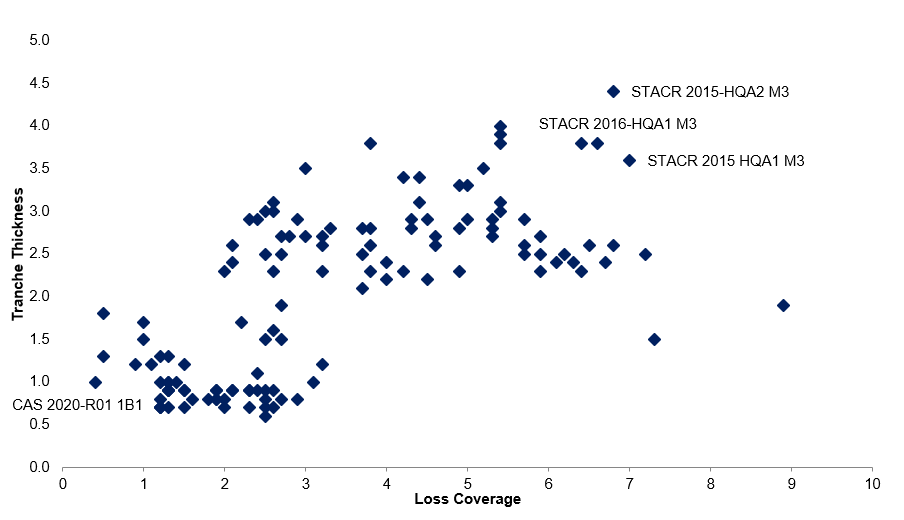
Source: Vista, Amherst Insight Labs, Amherst Pierpont
This framework would suggest that, all else equal, the thickest bonds with the highest amounts of loss coverage should trade at the tightest nominal spreads as they should be the lowest amount of credit risk in the universe. Admittedly, the framework does not account for loss coverage associated with a market value discount applied to bonds further down the capital structure, but unlike the legacy RMBS market where steep discounts to par can provide significant loss coverage, comparable discounts in CRT may only provide a small amount of incremental loss coverage especially in very thin, structurally levered B classes of these deals.
Relying solely on loss coverage and tranche thickness as a guidepost for relative value would suggest that M3 classes of 2015 and 2016 vintage high LTV STACR transactions should trade at some of the tightest nominal spreads as they exhibit some of the highest loss coverage multiples and thickest tranches in the universe analyzed. However, these bonds appear to trade at comparable spreads to more recent vintage M2 bonds. For example, STACR 2015-HQA2 M3 trades at roughly a $104. The bond has 260 bp of credit enhancement and is 440 bp thick. Based on our prepayment and COVID adjusted default assumptions, we estimate the bond has a loss coverage multiple of 6.8 times expected losses and has a discount margin of approximately 340 bp. By comparison STACR 2019-DNA1 M2 has slightly less credit enhancement at 190 bp, and is 290 bp thick. Based on prepayment and default assumptions, the bond has roughly 2.6 times expected loss coverage and trades at roughly a 325 DM. Investors can potentially pick up nominal spread while adding credit enhancement, decreasing structural leverage and sensitivity to potential future losses by rotating into seasoned M3s.
Admittedly, there may be a couple reasons for this. First, seasoned M3s generally trade at multiple point premiums to par and some of the expected nominal cheapness is associated with a slowdown in longer term speeds on these deals which are currently paying upwards of 40 CPR. Additionally, there is likely some liquidity premium associated with more recent vintage M2s that trade with more frequency, and therefore greater price transparency, than more seasoned cash flows.
Another potential source of relative value in the CRT market may be in moderately seasoned high LTV B1s relative to recently issued low LTV M2 classes. An illustrative example of this is comparing STACR 2019-HQA2 B1 to STACR 2020-DNA2 M2. The 2019-HQA2 B1 has 100 bp of credit enhancement is roughly 160 bp thick and trades at price of roughly $92. Based on model estimates, the bonds has roughly 2.6 times expected loss coverage and assuming a price of $92 trades to a roughly 540 DM. By comparison, the 2020-DNA2 is roughly the same thickness but has an incremental 40 bp of credit enhancement. We estimate the two deals to have roughly similar loss coverage ratios with slightly better loss coverage on the seasoned high LTV B1 at 2.6 times expected losses versus 2.2 times for the 2020 M2. However, the bonds appear to trade at substantially different nominal spreads despite similar risk profiles as a $95.25 price on the 2020 M2 translates to less than 300 DM assuming base case prepayment and COVID adjusted default assumptions. While there appears to be significant potential relative value opportunity, investors should think about additional overlays and risk based pricing adjustments especially in 2019 vintage high LTV bonds as this cohort appears to have potentially outsized exposure to modification losses given high WACs and large concentrations of high DTI borrowers. The trade can also be expressed in 2018 vintage B1s but these bonds tend to be somewhat thinner as the higher WAC 2019 vintage has experienced faster prepayments and as a result have delivered more, making the profile more comparable to 2020 low LTV M2s.