Uncategorized
Screening for carry in new specified pools
admin | August 14, 2020
This material is a Marketing Communication and does not constitute Independent Investment Research.
The TBA dollar roll these days may be the hottest spot for MBS carry in the market, but not all investors can get their MBS exposure by rolling contracts. Most banks and some other investors have to own pools and have to choose between taking delivery of TBA or buying specified. Some of the heaviest specified pool volume comes in new production, and a snapshot of the time needed for specified pool carry to cover the price premium to TBA points to good choices in pools backed by investment properties, low FICO loans, loans from Florida, and loans with balances between $150,000 and $225,000.
Calculating the time required for carry to cover price premium is a useful yardstick for investors concerned about current income. The breakeven is calculated by dividing the pay-up by the carry differential between the specified pool and the TBA. The TBA carry depends on whether an investor can roll their position, so it is useful to calculate the breakeven compared to both a rolled position and a generic pool. Calculating carry over a one-year horizon is a good match to the typical breakeven times.
Not every investor is concerned only about carry under a single interest rate path, of course. Some investors look for securities that can generate net interest income over a longer horizon and across a wide range of interest rates. They should look to OAS as a better metric to incorporate the value of the typically better convexity in specified pools. The best pool types for their portfolios might not offer the most current carry and take a long time to break even.
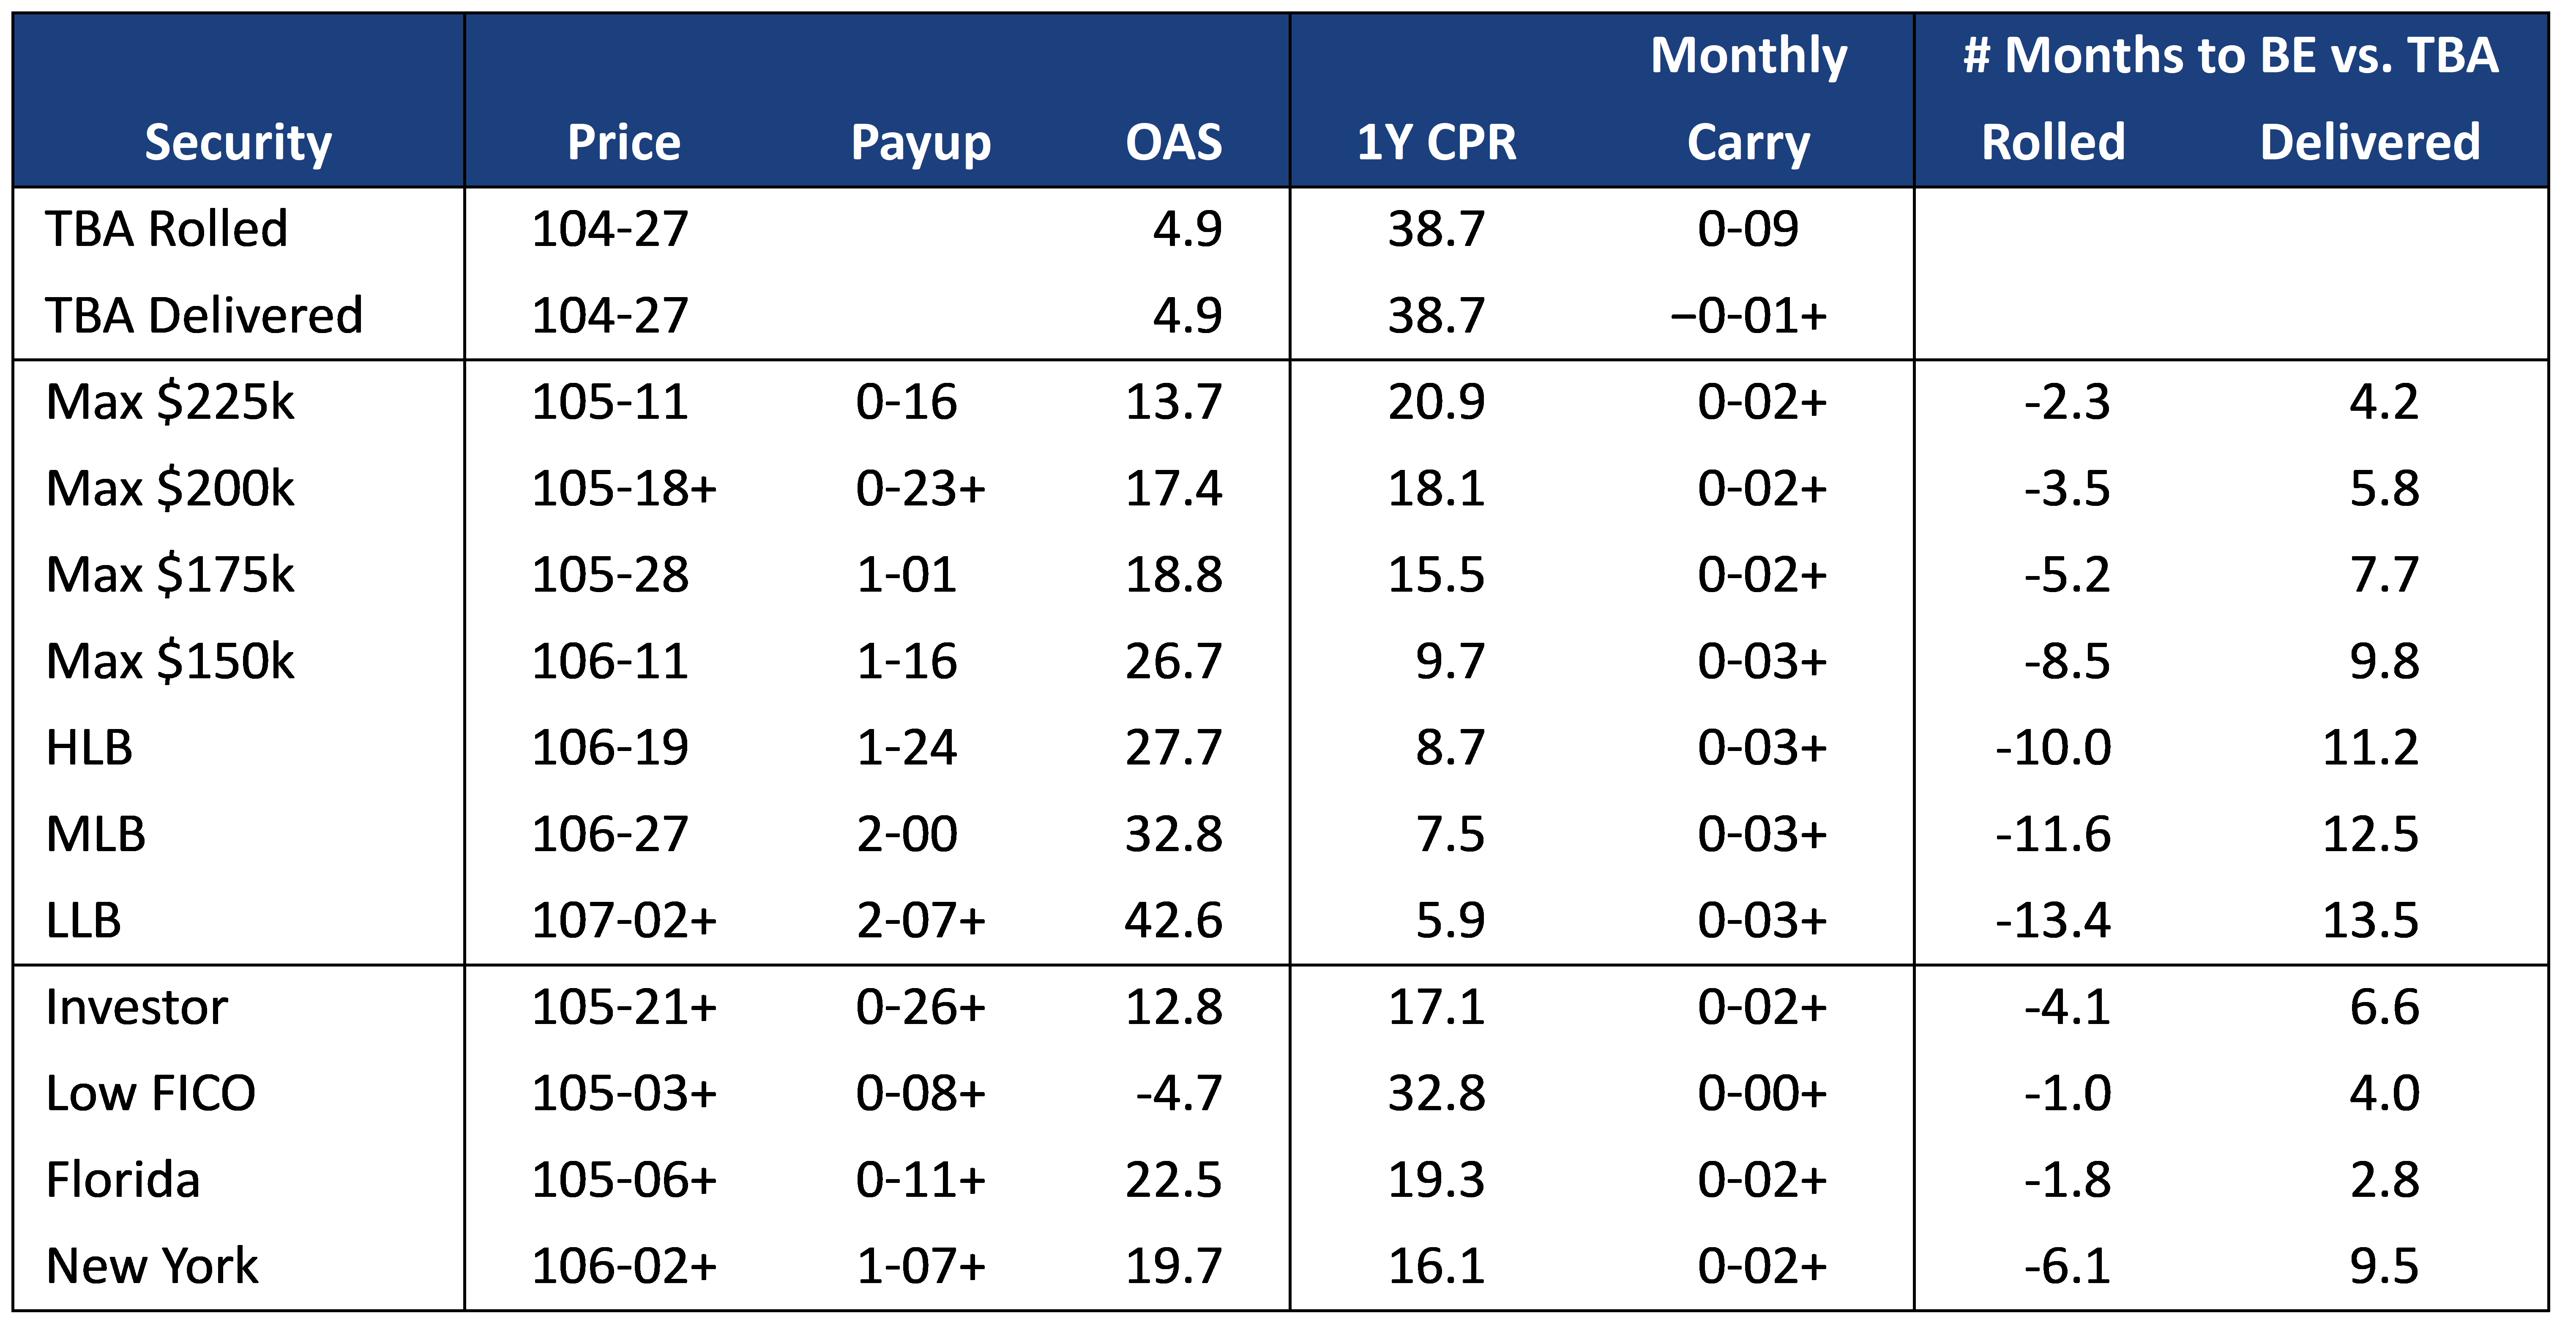
Screening UMBS 2.0%s
None of the specified pool stories in the UMBS 2.0% coupon carry better than rolling TBA, so the breakevens to rolling TBA are all negative. Most investors in this coupon will likely choose to roll. But investors unable to roll can recoup their pay-up fastest in some of the lower pay-up stories. Investor, low FICO, and 100% Florida pools all have pay-ups of less than 1-00 and break even in less than eight months. However, the low FICO pools’ OAS is very tight, indicating that Yield Book’s model does not think these pools will perform very well in other interest rate environments.
Exhibit 1: UMBS 2.0% Specified Pools

Note: the table shows pay-ups, OASs, and breakeven times for a variety of UMBS 2.0% pool types. All the specified pools are assumed to be new production with a 0 WALA. The first row shows monthly carry for an investor rolling TBA, and the second row is the carry for an investor that takes delivery of a generic TBA pool. The last two columns in the table show the breakeven vs. the rolled TBA position and vs. the delivered TBA pool. A positive breakeven is the number of months it takes to recover the pay-up, and a negative “breakeven” represents the number of months it takes to lose an amount equal to the pay-up. Monthly carry is the average carry over a 1 year horizon using 1 year prepayment speeds from Yield Book’s v99 model. Specified pools and delivered TBA positions use 0.46% financing rate. Source: Yield Book, Amherst Pierpont Securities
Screening UMBS 2.5%s
The picture is similar in 2.5%s—the best carry can be achieved by rolling TBA and the best carrying specified pools are the lower pay-up specified pools (Exhibit 2). The same low pay-up stories that carried well in 2.0%s also carry well in 2.5%s. But the lower pay-up loan balance pools—Max $175,000, Max $200,000, and Max $225,000–all look more attractive in this coupon. Low FICO pools also carry well but have very tight OASs, lower than TBA.
Exhibit 2: UMBS 2.5% Specified Pools
Note: Monthly carry is the average carry over a 1 year horizon using 1 year prepayment speeds from Yield Book’s v99 model. Specified pools and delivered TBA positions use 0.46% financing rate. Source: Yield Book, Amherst Pierpont Securities
Screening UMBS 3.0%s
The same pool types also offer the shortest breakevens in the 3.0% coupon (Exhibit 3). Max $225,000 pools, for example breakeven in merely 3.3 months because the pay-up has fallen to only $0-13. These pools pick roughly 16 bp OAS to TBA. The pay-up for low FICO pools is very low in this coupon, which results in a very short breakeven time and much better OAS than in lower coupons. These pools might be an attractive option to add a little extra carry and slightly better prepayment behavior than a generic pool with very little risk of losing the premium.
Exhibit 3: UMBS 3.0% Specified Pools

Note: Monthly carry is the average carry over a 1 year horizon using 1 year prepayment speeds from Yield Book’s v99 model. Specified pools and delivered TBA positions use 0.46% financing rate. Source: Yield Book, Amherst Pierpont Securities
TBA or not TBA, that is the question
With the TBA dollar roll hotter than Louisiana chili, total return portfolios should keep rolling contracts. As for investors looking for current carry, pools with relative low price premiums to TBA look like clear favorites.
This material is intended only for institutional investors and does not carry all of the independence and disclosure standards of retail debt research reports. In the preparation of this material, the author may have consulted or otherwise discussed the matters referenced herein with one or more of SCM’s trading desks, any of which may have accumulated or otherwise taken a position, long or short, in any of the financial instruments discussed in or related to this material. Further, SCM may act as a market maker or principal dealer and may have proprietary interests that differ or conflict with the recipient hereof, in connection with any financial instrument discussed in or related to this material.
This message, including any attachments or links contained herein, is subject to important disclaimers, conditions, and disclosures regarding Electronic Communications, which you can find at https://portfolio-strategy.apsec.com/sancap-disclaimers-and-disclosures.
Important Disclaimers
Copyright © 2026 Santander US Capital Markets LLC and its affiliates (“SCM”). All rights reserved. SCM is a member of FINRA and SIPC. This material is intended for limited distribution to institutions only and is not publicly available. Any unauthorized use or disclosure is prohibited.
In making this material available, SCM (i) is not providing any advice to the recipient, including, without limitation, any advice as to investment, legal, accounting, tax and financial matters, (ii) is not acting as an advisor or fiduciary in respect of the recipient, (iii) is not making any predictions or projections and (iv) intends that any recipient to which SCM has provided this material is an “institutional investor” (as defined under applicable law and regulation, including FINRA Rule 4512 and that this material will not be disseminated, in whole or part, to any third party by the recipient.
The author of this material is an economist, desk strategist or trader. In the preparation of this material, the author may have consulted or otherwise discussed the matters referenced herein with one or more of SCM’s trading desks, any of which may have accumulated or otherwise taken a position, long or short, in any of the financial instruments discussed in or related to this material. Further, SCM or any of its affiliates may act as a market maker or principal dealer and may have proprietary interests that differ or conflict with the recipient hereof, in connection with any financial instrument discussed in or related to this material.
This material (i) has been prepared for information purposes only and does not constitute a solicitation or an offer to buy or sell any securities, related investments or other financial instruments, (ii) is neither research, a “research report” as commonly understood under the securities laws and regulations promulgated thereunder nor the product of a research department, (iii) or parts thereof may have been obtained from various sources, the reliability of which has not been verified and cannot be guaranteed by SCM, (iv) should not be reproduced or disclosed to any other person, without SCM’s prior consent and (v) is not intended for distribution in any jurisdiction in which its distribution would be prohibited.
In connection with this material, SCM (i) makes no representation or warranties as to the appropriateness or reliance for use in any transaction or as to the permissibility or legality of any financial instrument in any jurisdiction, (ii) believes the information in this material to be reliable, has not independently verified such information and makes no representation, express or implied, with regard to the accuracy or completeness of such information, (iii) accepts no responsibility or liability as to any reliance placed, or investment decision made, on the basis of such information by the recipient and (iv) does not undertake, and disclaims any duty to undertake, to update or to revise the information contained in this material.
Unless otherwise stated, the views, opinions, forecasts, valuations, or estimates contained in this material are those solely of the author, as of the date of publication of this material, and are subject to change without notice. The recipient of this material should make an independent evaluation of this information and make such other investigations as the recipient considers necessary (including obtaining independent financial advice), before transacting in any financial market or instrument discussed in or related to this material.
Important disclaimers for clients in the EU and UK
This publication has been prepared by Trading Desk Strategists within the Sales and Trading functions of Santander US Capital Markets LLC (“SanCap”), the US registered broker-dealer of Santander Corporate & Investment Banking. This communication is distributed in the EEA by Banco Santander S.A., a credit institution registered in Spain and authorised and regulated by the Bank of Spain and the CNMV. Any EEA recipient of this communication that would like to affect any transaction in any security or issuer discussed herein should do so with Banco Santander S.A. or any of its affiliates (together “Santander”). This communication has been distributed in the UK by Banco Santander, S.A.’s London branch, authorised by the Bank of Spain and subject to regulatory oversight on certain matters by the Financial Conduct Authority (FCA) and the Prudential Regulation Authority (PRA).
The publication is intended for exclusive use for Professional Clients and Eligible Counterparties as defined by MiFID II and is not intended for use by retail customers or for any persons or entities in any jurisdictions or country where such distribution or use would be contrary to local law or regulation.
This material is not a product of Santander´s Research Team and does not constitute independent investment research. This is a marketing communication and may contain ¨investment recommendations¨ as defined by the Market Abuse Regulation 596/2014 ("MAR"). This publication has not been prepared in accordance with legal requirements designed to promote the independence of research and is not subject to any prohibition on dealing ahead of the dissemination of investment research. The author, date and time of the production of this publication are as indicated herein.
This publication does not constitute investment advice and may not be relied upon to form an investment decision, nor should it be construed as any offer to sell or issue or invitation to purchase, acquire or subscribe for any instruments referred herein. The publication has been prepared in good faith and based on information Santander considers reliable as of the date of publication, but Santander does not guarantee or represent, express or implied, that such information is accurate or complete. All estimates, forecasts and opinions are current as at the date of this publication and are subject to change without notice. Unless otherwise indicated, Santander does not intend to update this publication. The views and commentary in this publication may not be objective or independent of the interests of the Trading and Sales functions of Santander, who may be active participants in the markets, investments or strategies referred to herein and/or may receive compensation from investment banking and non-investment banking services from entities mentioned herein. Santander may trade as principal, make a market or hold positions in instruments (or related derivatives) and/or hold financial interest in entities discussed herein. Santander may provide market commentary or trading strategies to other clients or engage in transactions which may differ from views expressed herein. Santander may have acted upon the contents of this publication prior to you having received it.
This publication is intended for the exclusive use of the recipient and must not be reproduced, redistributed or transmitted, in whole or in part, without Santander’s consent. The recipient agrees to keep confidential at all times information contained herein.


