


Uncategorized
Liquidity and its fair value
admin | August 14, 2020
This material is a Marketing Communication and does not constitute Independent Investment Research.
Fed QE by design tries to push investors out of safer assets into riskier ones and owning less liquid assets is one way to get there. But relative liquidity across assets may not be clear and fair value for taking liquidity risk may be even further out of reach. But there are rough proxies for both, and they should become increasingly useful in a market where liquidity risk stands to be a good source of return.
Even though investors constantly weigh asset liquidity, practical measures are uneven. The New York Fed does publish average daily trading volume across a wide set of assets (here). But bid-ask spreads are largely anecdotal, absent careful analysis of TRACE data, and the price impact of trade flows is difficult to measure.
The repo market, however, gauges liquidity every day through the haircut or margin it sets for different assets. Repo desks take in assets as collateral against loans, and those desks have to understand the potential cost of selling the collateral in a distressed market. In deep and liquid markets, such as the market for Treasury debt, for instance, the time to sale and price impact is small. In thinner and less liquid markets, such as the market for whole loans, the time to sale is longer, the exposure to market risk is greater and the price impact can be large. Repo haircuts reflect differences in the expected time and cost of liquidation, so they can serve as a market estimate of relative liquidity.
Haircuts for a given asset differ across repo desks, and the dispersion of haircuts also says something about asset liquidity. In a market with standardized assets and transparent pricing, most repo providers will have a similar view of liquidity and dispersion will be small. In a market with little standardization across assets and opaque pricing, views will differ, and dispersion will be larger.
Data from the New York Fed reflects clear differences in repo haircuts and dispersion in haircuts across assets. The market in US Treasury bills, notes and bond reads as the most liquid with a median haircut in 2020 of 2% and a standard deviation across transactions of 0.63%. Agency MBS comes next with a median haircut of 2% and a standard deviation of 0.88%. US Treasury STRIPS and agency debentures and STRIPS follow also with 2% haircuts and larger standard deviations. At the other extreme fall investment grade and noninvestment grade ABS and noninvestment grade corporate debt with haircuts between 7% and 9% and standard deviations between 4.6% and 7.1%.
Exhibit 1: Repo haircuts, a proxy for liquidity, differ significantly across assets
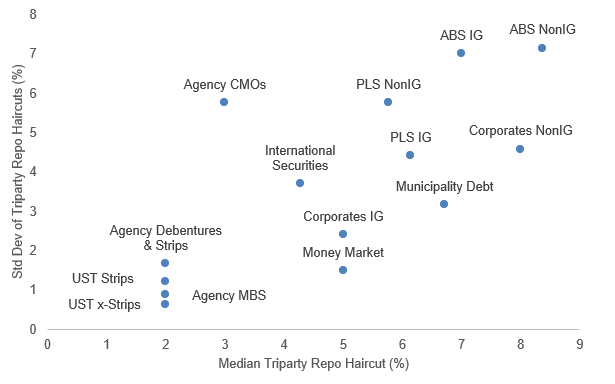
Note: Data show the median haircut and the standard deviation of haircuts across asset classes from January to July 2020 in the triparty repo market. Source: FRB New York
The picture of differences in liquidity through triparty repo parallels differences in trading volume and also lines up roughly with the share of trading in each asset held by the Top 3 dealers. In the most standardized and transparent markets, share is harder to hold. In the market for Treasury bills, notes and bonds, the Top 3 hold only 31%. In agency debentures and STRIPS, 35%. In MBS, 36%. At the other extreme, in investment grade and noninvestment grade ABS, Top 3 share ranges from 51% to 54%. More concentrated markets presumably mean fewer dealers willing to provide liquidity to the asset.
Exhibit 2: Top 3 dealer share of trading tends to rise as liquidity falls
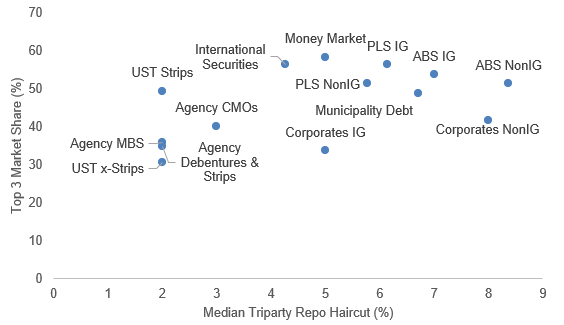
Note: Data show the median haircut in the triparty repo market and the Top 3 dealer share of trading volume across asset classes from January to July 2020. Source: FRB New York
As for the fair value of liquidity, that is high art but not impossible. Beyond the common approach through on- and off-the-run Treasury debt, one route to an answer runs through the market in ‘AAA’ corporate debt. Most of the spread in the market is compensation for liquidity, not credit. Since 1970, according to Moody’s 2019 annual default study, the average ‘AAA’ corporate bond after 10 years has a 0.37% chance of being in default with an ultimate recovery of 47.7% for an expected loss of 0.18%. Although readily available data on ‘AAA’ spreads does not go back that far, the ICE BoA AAA Corporate Index OAS since 1996 has run at a median of 0.68%. It is consequently fair to assume that 26% of the typical ‘AAA’ spread to the Treasury curve is for credit risk and 74% is for liquidity risk. Today’s ‘AAA’ index OAS is 71 bp, implying the fair value for the liquidity difference between Treasury debt and ‘AAA’ corporate debt is 53 bp.
Based on the picture of relative liquidity from repo, that 53 bp should scale up or down for each asset class. The fair liquidity premium for the average Treasury bill, note or bond is 0 bp, for agency MBS it is 3 bp and for US Treasury STRIPS and agency STRIPS and debentures it ranges from 6 bp to 12 bp (Exhibit 3). At the other extreme, the fair value for liquidity in investment grade and noninvestment grade ABS ranges from 111 bp to 126 bp.
Exhibit 3: The estimated fair value for liquidity varies widely across assets
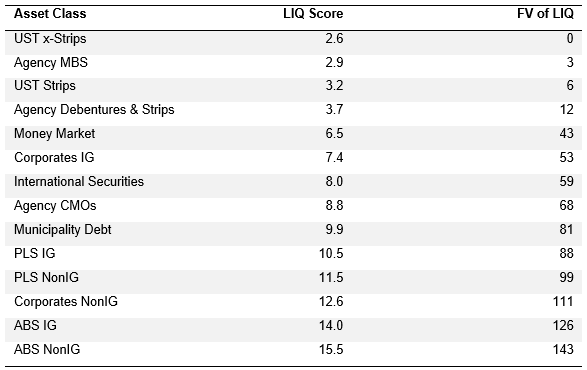
Note: LIQ score calculated as the simple sum of the median haircut and the standard deviation of haircuts across asset classes from January to July 2020 in the triparty repo market. UST x-Strips, for example, has a median of 2% and a standard deviation of 0.63% for a LIQ score of 2.63%. Source: FRB New York, Amherst Pierpont Securities
To be clear, assets can trade at spreads well above the fair value of liquidity as compensation for other risks. And assets can trade tight to the fair value of liquidity because they offer something for which investors willingly pay a premium. Agency CMOs might be a good example of that. Many agency CMOs today trade inside the estimated fair value spread for liquidity of 68 bp. But these same CMOs may allow banks to buy securities priced close to par in a market where high prices and high prepayments create earnings risk from rapid amortization of price premiums.
Owning assets with lower liquidity looks like a good source of return in a market with an aggressively accommodative Fed. Not only does the Fed continue putting cash into the financial system through QE, it also clears the Street’s balance sheet of $80 billion monthly in Treasury debt and at least $40 billion monthly in MBS, making room for the Street to warehouse risk in other assets. Liquidity risk premiums should continue declining, and that should have a magnified effect in the least liquid assets. Fair value for liquidity in most corporate and structured credit is already a multiple of the yield on the safest assets, and those assets provide fair compensation for other embedded risks. If liquidity were an asset class, the prospects for the high beta part of the market looks good.
* * *
The view in rates
The rates market has started to entertain prospects of growth. After steadily declining since early June, real rates rose from -103 bp on August 10 to finish on August 14 at -95 bp. The market also continues to add to its expectations of inflation with the spread between 10-year notes and TIPS implying inflation of 165 bp. Real rates still could fall if the Fed in September shows willingness to let inflation return to target and go higher, all the while holding nominal rates down. The curve also steepened aggressively, with 2s10s going from 44 bp on August 10 to finish August 14 at 56 bp, and 5s30s running from 125 bp to 145 bp. QE should continue biasing the curve to steepen.
The view in spreads
Its spread compression as far as the eye can see. As the Fed continues to absorb high quality assets and spreads tighten, investors will have to move to the next tier of higher risk to get sufficient margin. Risk assets remain caught between Fed buying on one hand and heavy net supply of Treasury debt on the other. There is still fundamental risk in the most leveraged corporate balance sheets with corporate leverage going up through 2020, and only there might spreads continue lagging the rest of the market.
As a side effect of the steeper Treasury curve, projected OAS in MBS should rise as should estimated option-adjusted duration. A steeper curve presents prepayment models with rising rates, and will almost the entire MBS market trading at a premium, rising rates mean slower prepayments and better spreads.
The view in credit
The downside in leveraged credit outweighs the upside for now. Many investment grade companies have stockpiled enough cash to survive protracted slow growth, but highly leveraged companies and consumers are at risk. Prices on some sectors of leveraged loans, rating agency downgrades in leveraged loans and high yield and rising bank loan loss reserves signal a wave of distressed credit. Elevated unemployment and delinquency rates in assets from MBS to auto loans show pressure on the consumer balance sheet. However, monetary and fiscal policies are both shoring up these fundamentals for now. The course of leveraged corporate and consumer credit also depends on renewal of fiscal support and other programs.