


Uncategorized
The Fed keeps cleaning up TBA
admin | July 31, 2020
This document is intended for institutional investors and is not subject to all of the independence and disclosure standards applicable to debt research reports prepared for retail investors. This material does not constitute research.
With $890 billion of MBS in Fed hands since mid-March and another $40 billion heading that way monthly, the Fed continues to improve the quality of deliverable TBA pass-throughs. The Fed has removed some of the largest loan balances and worst convexity from the market by taking delivery of TBA trades and concentrating its purchasing in the most negatively convex coupons. But filtering out negative convexity and helping keep TBA dollar rolls special has also kept pressure on pay-ups for specified pools.
Improving the quality and OAS of the TBA float
One way to illustrate that the Fed has removed worse collateral from the 30-year MBS market is to calculate OASs first for pools that represent the average characteristics of the Fed’s purchases and then for all other MBS pools after excluding CMO holdings and specified pools (Exhibit 1). Each pool is run at that coupon’s TBA price. The Fed’s OASs range from 6 bp tighter in 2.0%s and 2.5%s to 60 bp tighter in 3.0%s.
Exhibit 1: The Fed buys pools at tight OASs
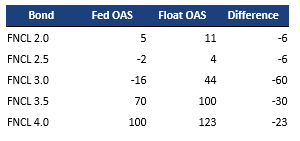
Note: OASs calculated as of 7/20/2020 using Yield Book’s experimental model using collateral attributes shown in Exhibit 4. Source: Yield Book, Amherst Pierpont Securities
The Fed’s portfolio mix and share of the float
Almost 70% of the purchases have been in 30-year 2.5%s and 3.0%s (Exhibit 2), but over the last two months the Fed has also bought a significant amount of 2.0%s. The Fed has not bought coupons greater than 3.0% since May 8, and the 2.0% coupon was 40% of their overall buying in July. This shift to lower coupons is a response to increasing production of that coupon as originators have tightened the difference between primary and secondary spreads to maintain origination volumes. The Fed has the greatest influence on mortgage rates by concentrating purchases in production coupons.
Exhibit 2: UMBS QE4 purchases were concentrated in 2.5%s and 3.0%s
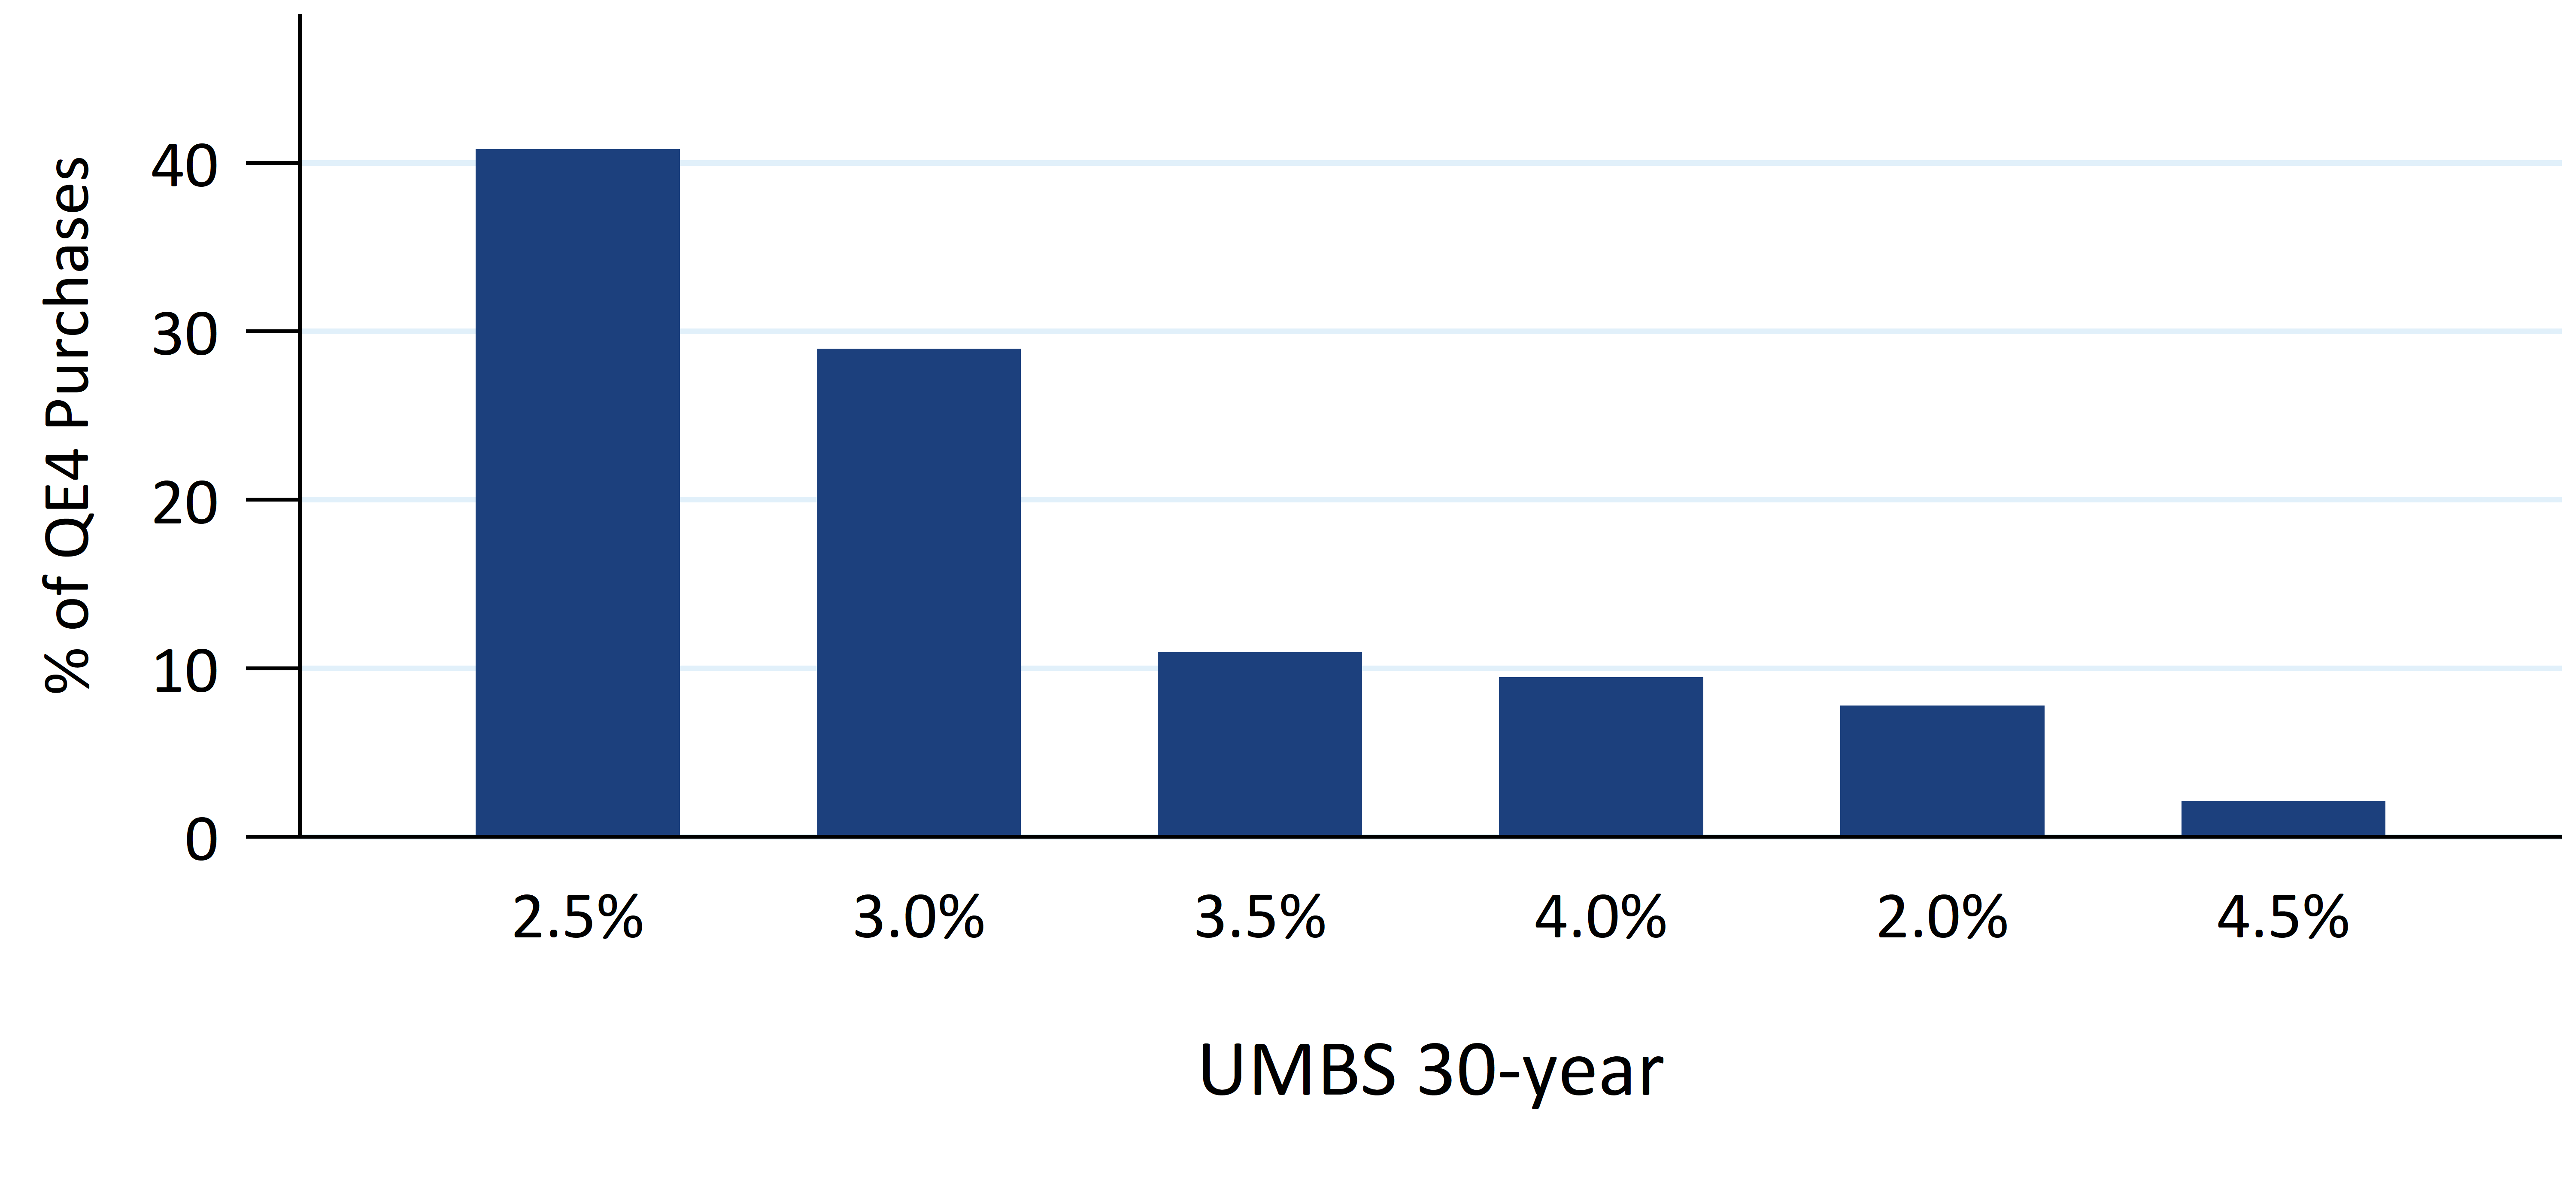
Note: Sorted from highest to lowest, data through 7/29/2020. Source: Federal Reserve, Fannie Mae, Freddie Mac, Ginnie Mae, eMBS, Amherst Pierpont Securities
The Fed ‘s buying has removed roughly 50% of the total float in 30-year 2.5%s and close to 40% of the float of 2.0%s (Exhibit 3). The heavy Fed activity in these coupons, and in 3.0%s, has contributed to those rolls trading special since the Fed increases aggregate demand to buy TBAs and improves the TBA price by removing worse convexity pools from the float.
Exhibit 3: Fed buying has had the largest effect on 2.0%s and 2.5%s
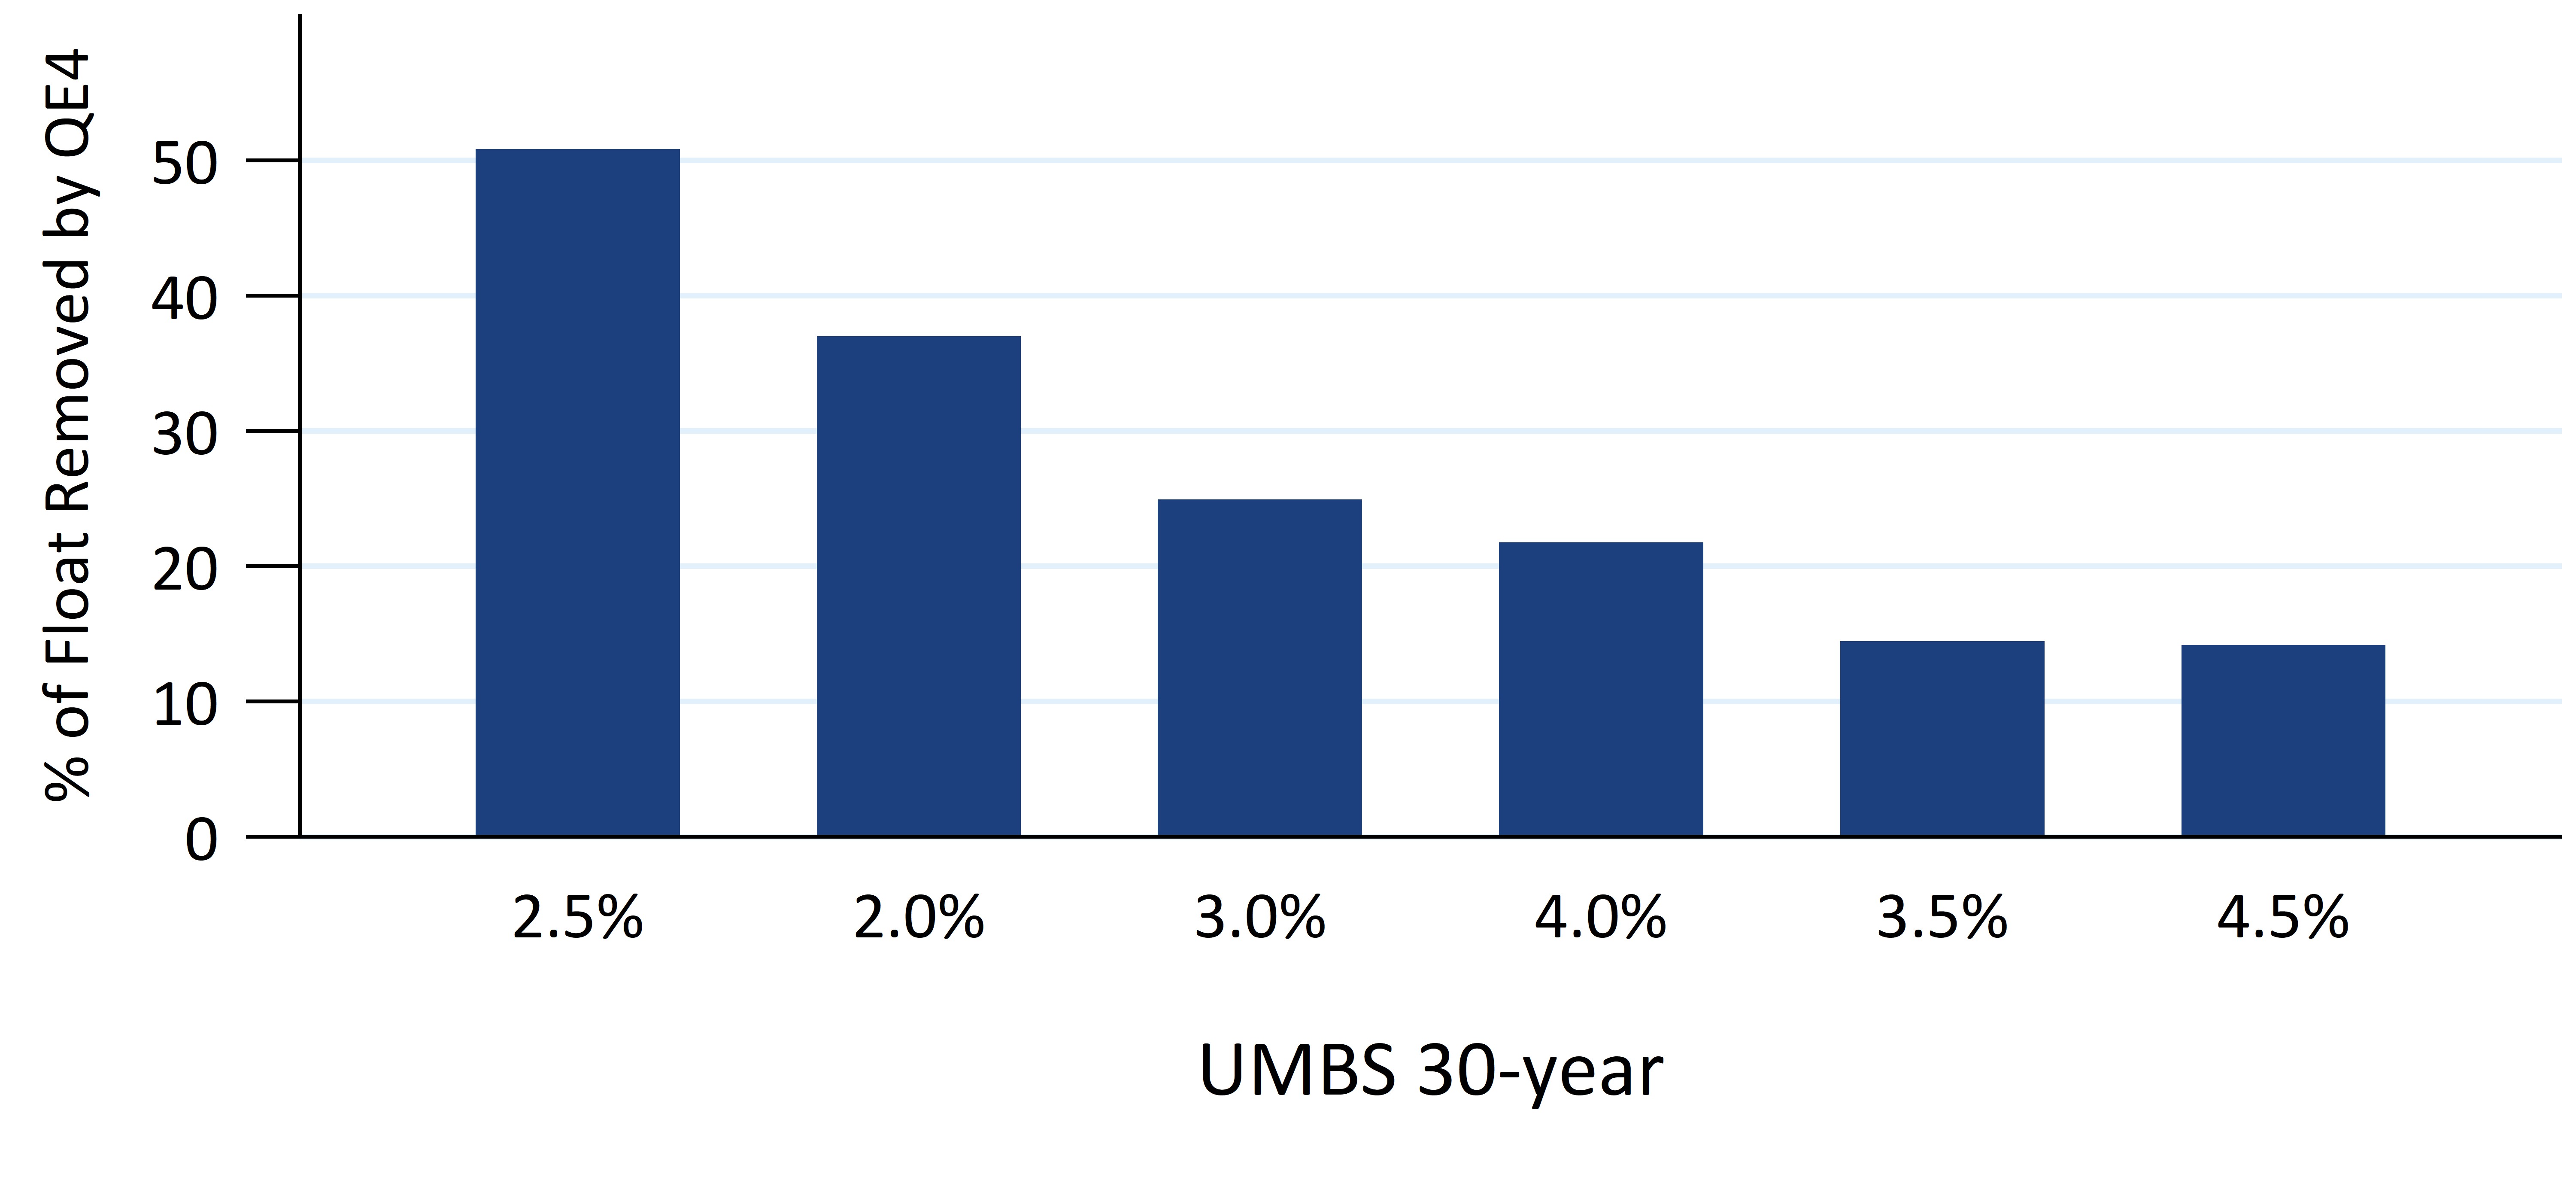
Note: The % of that coupon’s float removed by the Fed’s QE4 purchasing. The float is measured before QE4 and removes any pools owned by the Fed, in CMOs, or in spec pools at the start of QE4. Sorted from highest to lowest. Source: Federal Reserve, Fannie Mae, Freddie Mac, Ginnie Mae, eMBS, Amherst Pierpont Securities
Taking higher loan balances out of the float
The Fed has bought pools that are consistently higher average loan size than the remaining float and generally higher than 2019 and 2020 vintage float (Exhibit 4). For example, purchases in 30-year 2.5%s had an average loan size of $347,000 compared to $320,000 for the float—after removing specified pools and pools in CMOs—and $321,000 for the remaining 2020 vintage. The one small exception is their purchases in 4.0%s have roughly the same loan size as the small amount of 2020 production.
The Fed’s 3.0% pools should prepay much faster over the coming months, assuming rates do not move higher. These pools have benefitted from slower prepayments speeds typical of newly originated loans. However, these pools are currently 7 WALA and that prepay protection should rapidly vanish.
Valuation impact
The improving quality of TBA should broadly improve the performance of MBS against other assets by reducing the negative convexity of the market. A better TBA also starts to close the convexity gap to specified pools, reducing the relative value of the specified market. By taking delivery on TBA trades, the Fed has also helped keep dollar rolls special in coupons with heavy Fed buying. The special rolls further reduce the difference in monthly carry between TBA and specified pools, another source of pressure on specified pool pay-ups.
Exhibit 4: UMBS 30-year
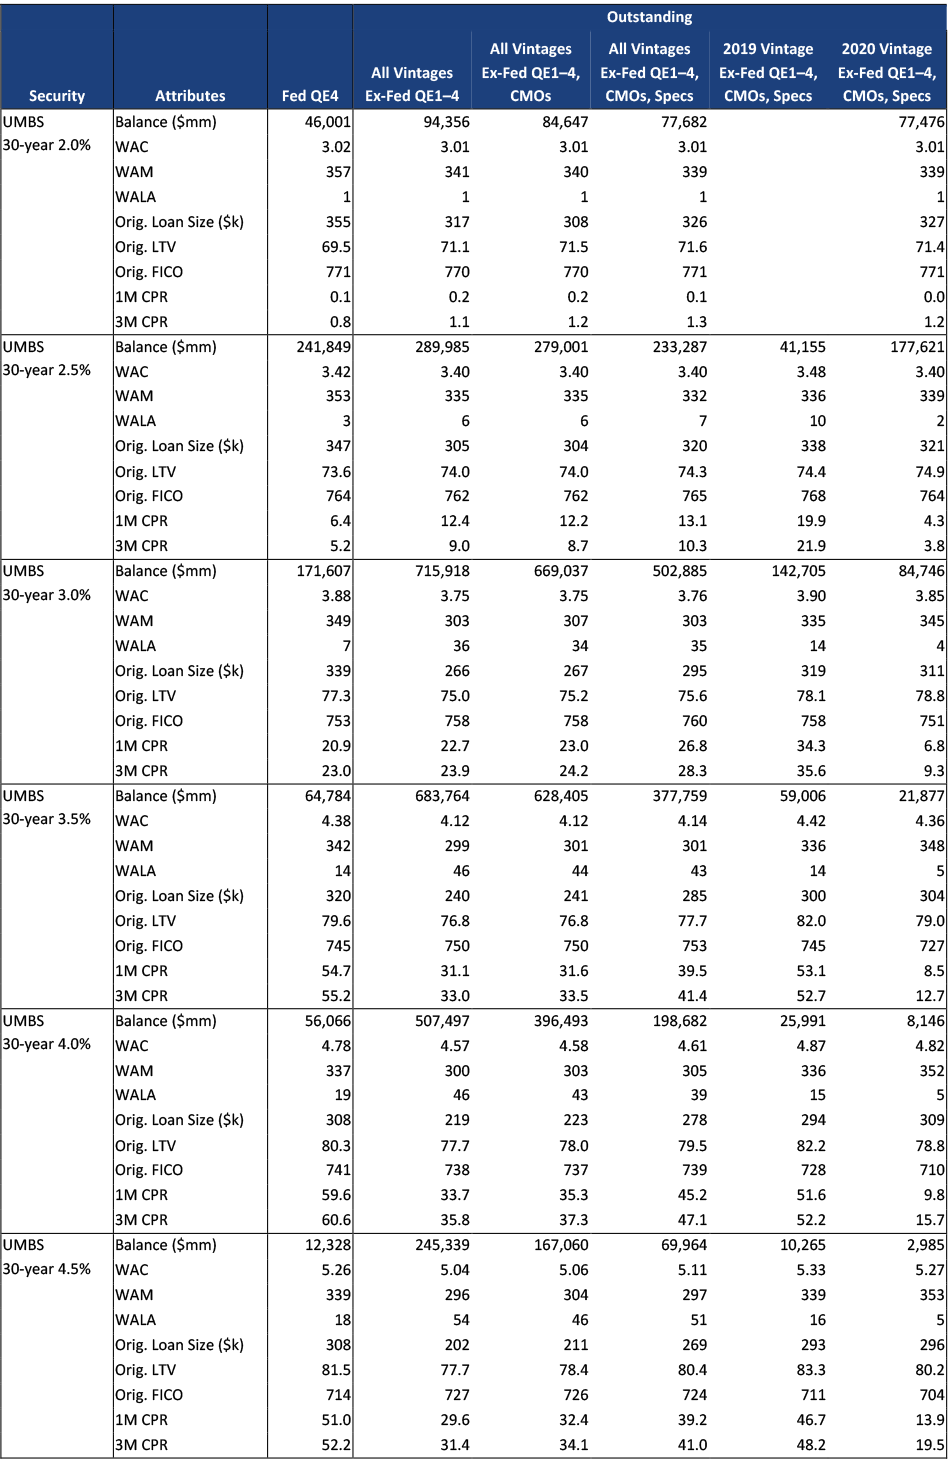
Note: The float includes 20-year MBS as non-specified collateral since there is currently no pay-up for these pools and prepayment speeds have been very fast. Source: Federal Reserve, Fannie Mae, Freddie Mac, Ginnie Mae, eMBS, Amherst Pierpont Securities
Exhibit 5: Ginnie Mae 30-year

Source: Federal Reserve, Fannie Mae, Freddie Mac, Ginnie Mae, eMBS, Amherst Pierpont Securities
Exhibit 6: UMBS 15-year
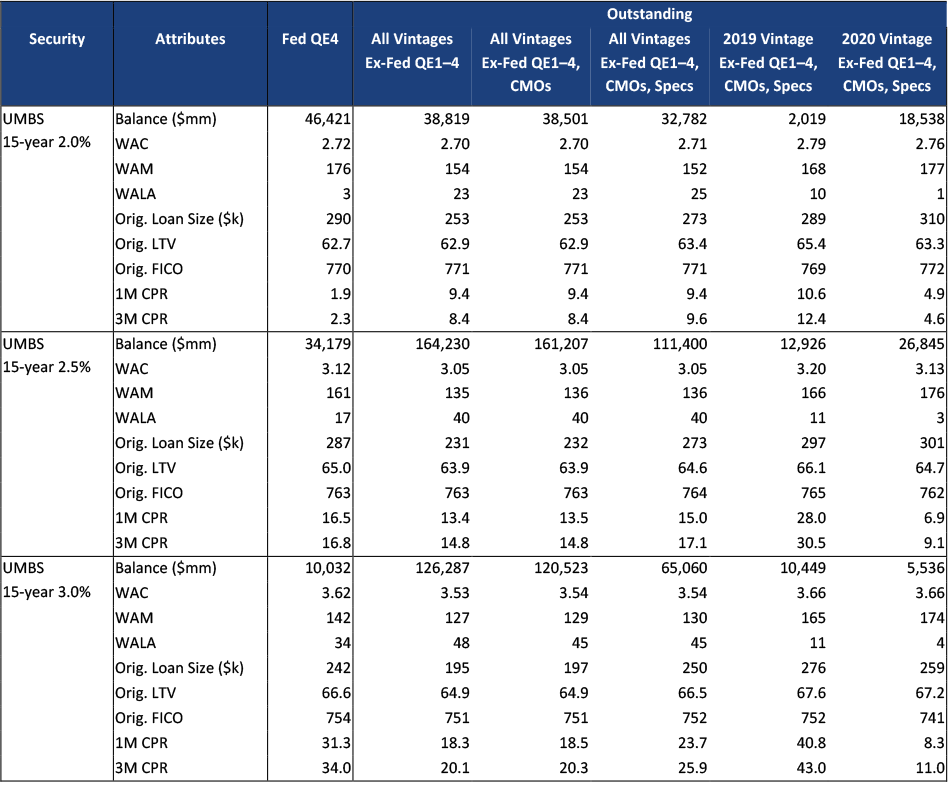
Source: Federal Reserve, Fannie Mae, Freddie Mac, Ginnie Mae, eMBS, Amherst Pierpont Securities