


Uncategorized
Returns to duration, prepayment and credit risk
admin | July 31, 2020
This document is intended for institutional investors and is not subject to all of the independence and disclosure standards applicable to debt research reports prepared for retail investors. This material does not constitute research.
Bank investment portfolios have a tough job this year. They have to generate net interest income with historically low asset yields and a marginal cost of funds effectively floored at zero. Heavy MBS prepayments have created pressure to reinvest. So has a 22% year-to-date rise in deposits across larger banks. The Fed came out of CCAR this year warning banks to preserve capital against a Covid-19 stress, so banks have to keep a close eye on asset credit quality and liquidity. The playbook is getting very limited.
The state of the rest of the average bank’s balance sheet is not helping either. Banks have tightened lending standards across commercial, consumer and real estate lending. After stripping out highly profitable loans for the Paycheck Protection Program, the C&I book is shrinking. A jump in loan loss reserves has driven profitability to its lowest level since 2009 (Exhibit 1). With core lending unlikely to fill the profit hole created by rising reserves, banks will likely put more demand on the investment portfolio.
Exhibit 1: As bank loan loss reserves jump… Profitability has fallen back to 2009 levels
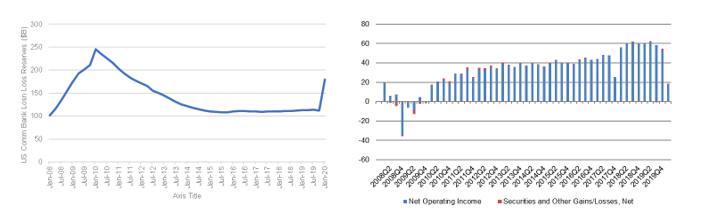
Source: FDIC, Amherst Pierpont Securities
Securities portfolios grow faster than any other asset except cash
Banks so far have responded by growing their investment portfolios faster than any other asset on the balance sheet except cash, which is up 92.4%. Total securities have jumped 13.3% year-to-date led by growth in Treasury and agency debt, a clear nod to stress scenario capital and liquidity (Exhibit 2). Loans and leases have risen by 1.4%.
Exhibit 2: Treasury and agency debt has led the rise in bank securities growth
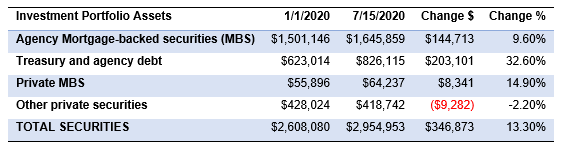
Source: Federal Reserve H.8 for large domestically chartered commercial banks
Getting yield from duration
Given the tight limits on many bank portfolios, many have tried to add yield by taking longer duration. The percentage of bank securities maturing or repricing after 15 years or more rose year-over-year through the first quarter of this year by 3.8% (Exhibit 3). The percentage of securities maturing or repricing in three years or less barely changed, up 0.3%. Of course, it is also possible that banks see asset duration falling as MBS durations shorten and need to add duration elsewhere in the portfolio. Managing balance sheet duration rather than generating yield may also explain the flow into longer duration.
Exhibit 3: Banks steadily extend securities duration
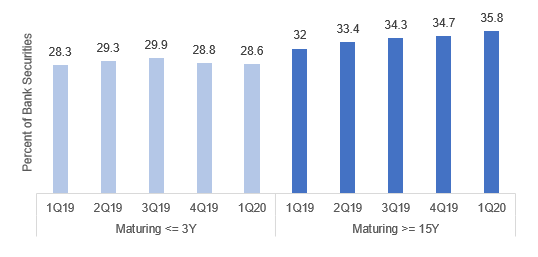
Source: S&P
The main bank instruments for extending duration include nearest-to-par agency pass-throughs, last-cash-flow agency CMOs and agency CMBS (Exhibit 4). These assets meet the need for relative safety, relative liquidity and better yield than Treasury debt. The strongest candidates look like 30-year 2.0% pass-throughs, 2.0% LCF sequential CMOs backed by 30-year 2.0%s and the long end of the agency CMBS curve. Nevertheless, the yields on all of these instruments come in at 1.50% or less.
Exhibit 4: Common instruments for extending bank portfolio WAL and duration
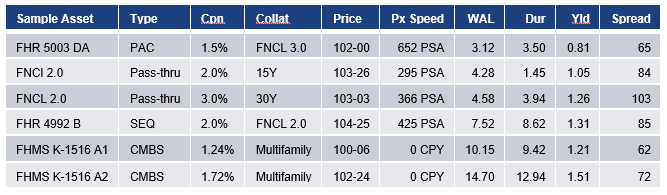
Note: all market levels as of COB 7/28/20. Source: Amherst Pierpont Securities
The challenge to generating returns from longer duration is that the benchmark Treasury curve is rich. After stripping out the likely path of fed funds and the expected erosion of buying power from inflation, Treasuries have negative yields. And the longer the maturity, the more negative the yield. The term premium on 2-year Treasury debt is -62 bp, on 5-year it is -82 bp and on 10-year it is -92 bp (Exhibit 5). Bank investors need to demand steadily wider at longer maturities spread to overcome the negative term premium along the Treasury curve.
Exhibit 5: Riskless duration comes at a cost in buying power after stripping out inflation
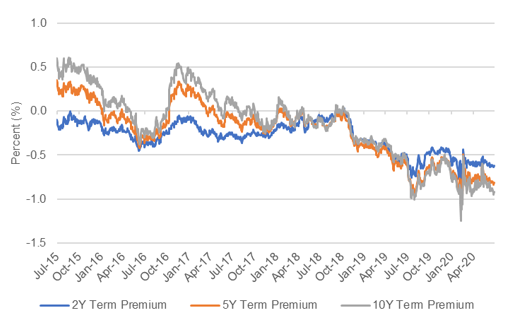
Source: Federal Reserve Bank of New York, Amherst Pierpont Securities
Getting yield for prepayment, credit and liquidity risk
Banks investors would do well to consider prepayment, credit and liquidity risk as other sources of yield. A modest increase in negative convexity through agency premium 30- or 15-year pass-throughs or synthetic premium CMOs could add to yield, for example. Banks with strong capital ratios could take some credit risk in investment grade private MBS or ABS or even ‘AAA’ CLOs.
Bank investors can match or exceed the yield available through longer maturities by taking the combination of prepayment, credit and liquidity risk embedded in ‘AAA’ private MBS (Exhibit 6). For example, ‘AAA’ prime jumbo 3.0% pass-throughs priced $2-04 behind TBA FNCL 3.0%s offer yield for taking significant negative convexity. A stronger candidate might be the ‘AAA’ front sequential class off RPL securitizations, which offer a combination of credit risk and modest negative convexity for yield. The details of each security matter, but a shorter average life and prospectively equal or better yield looks more attractive than locking in longer cash flows in a market with negative and inverted term premiums.
Exhibit 6: Alternatives for adding yield to bank portfolios
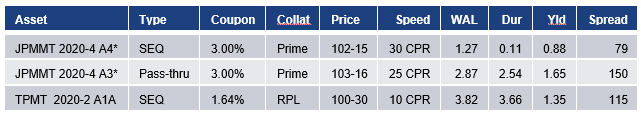
Note: *Traditionally quoted as a price concession to TBA pass-throughs. JPMMT 2020-4 A3 traded $2-04 back of TBA with FNCL 3s (Aug) at 105-20 on 7/29/30. JPMMT 2020-5 A3 came to market 7/1/20 at $2-16 back of FNCI 3s (Aug). Estimate on 7/29 at 2-14 back with FNCI 3s (Aug) at 104-29. Speed, WAL, duration and yield estimated from Bloomberg. Source: Amherst Pierpont Securities
As PPP loans run off through August and September and leave more cash on the balance sheet, bank investment portfolios will need to consider a wide menu of ways to rebuild profitability. Adding duration is one common way, but it is far from the only or even the best game in town.