Uncategorized
The case for Ginnie Mae low WALA and post-buyout bank pools
admin | July 24, 2020
This material is a Marketing Communication and does not constitute Independent Investment Research.
Servicer activity has turned the tables on investors expecting dampened prepayments from borrowers taking Covid-19 forbearance. Ginnie Mae speeds jumped in June caused largely by bank servicer buyouts of loans taking forbearance and consequently considered delinquent. Speeds for these servicers should jump again in July but fall afterwards. Since the pace of new delinquencies has fallen, new issue pools should also face much lower buyout risk. Buy the Ginnie Mae post-buyout bank pools and the low WALA pools.
Buyout incentives for banks despite new Ginnie Mae rules
Ginnie Mae recently announced restrictions on pooling loans that the agency hopes will slow buyouts. Loans brought out of delinquency without modification may only be delivered into custom pools and must meet payment history and seasoning requirements before pooling. This is effective for buyouts beginning in July. Servicers can make a lot of money buying out loans at par and resecuritizing at a premium (a recap of the economics is here). Ginnie Mae’s rules cut into this premium by forcing the servicer to wait at least seven months before repooling, which substantially reduces the economics. But this has a much smaller effect on banks than on non-banks since banks’ funding costs are low, so the rules are unlikely to deter future bank buyouts.
Accounting rules also encourage banks to buy out delinquent loans. Wells Fargo, for instance, has noted (here) that “loans in Ginnie Mae pools must be consolidated on a bank’s balance sheet once the loan is more than 90 days past due, regardless of the circumstances.” Without this rule, banks might have an incentive to keep delinquent loans in pools and off balance sheet.
Bank buyouts were very high in June
Loans bought out in June are not subject to Ginnie Mae’s new pooling rules. However, only bank servicers bought out an appreciable number of eligible loans (Exhibit 1).
Exhibit 1. Banks bought out 69% of eligible loans in June
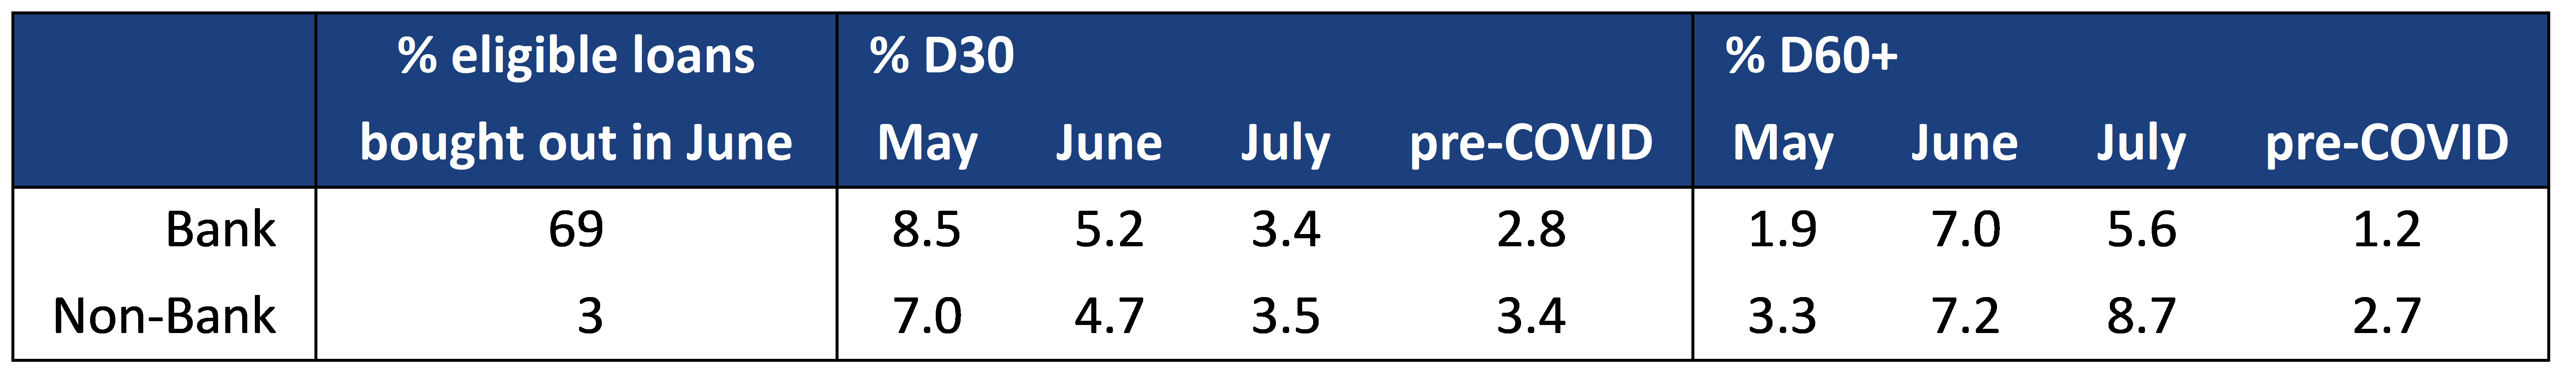
Note: Pre-COVID is January 2019 through March 2020. Source: Ginnie Mae, eMBS, Amherst Pierpont Securities
Servicers can buy out loans once they are 90-days delinquent. But this means a loan that starts the month 60-days delinquent can be bought out during the upcoming month. Investors need to look at a pool’s 60-days or greater delinquent population to assess the potential buyout risk in a pool. The percentage of 60-day or more delinquent loans in bank pools fell from June to July due to the high buyout rate, while the percentage increased for non-bank servicers. It is also useful to compare to pre-Covid average levels, to show how much higher the current delinquency rates are than they were prior to Covid.
The 30-day delinquent numbers, however, have fallen dramatically since May and are very close to the pre-Covid levels. This implies that the pace of new delinquencies has fallen close to pre-Covid levels. Another way to see this is to look at the 30-day and greater delinquency rates for non-banks in June and July—11.9% [4.7%+7.2%] and 12.2% [3.5%+8.7%], respectively. Buyouts and natural curing were both very low, which means there were few new delinquencies in June. The slow pace of new loans entering forbearance has also been reported by the MBA.
Reviewing the largest bank and non-bank servicers shows that most of the buyouts were conducted by five large banks (Exhibit 2). Wells Fargo, U.S. Bank, Truist Bank, and Chase each bought out virtually every loan that became 90 days delinquent during the month of June, and M&T bought out 66% of eligible loans.
Exhibit 2. Four of the largest banks bought out almost all eligible loans
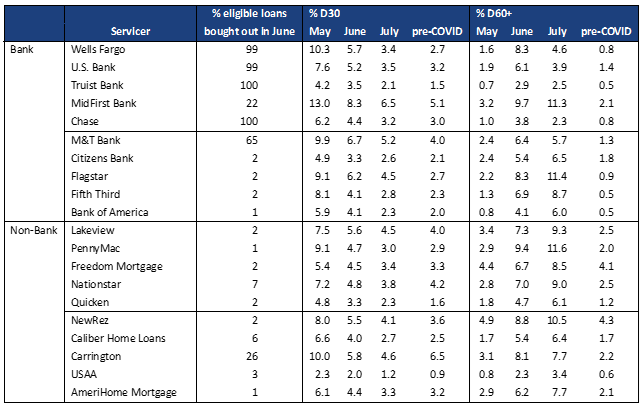
Note: Pre-COVID is January 2019 through March 2020. Source: Ginnie Mae, eMBS, Amherst Pierpont Securities
The percentage of loans at least 60-days delinquent is much lower for the servicers with large buyouts, while other servicers’ pools still have a huge population of delinquent loans. Some of these loans will become buyouts—most VA loans are likely to require loan modifications to cure their Covid delinquencies, which mandates a buyout. And some FHA loans will not qualify for a deferred payment, also mandating a buyout.
Non-bank servicers might choose to leave FHA loans that receive partial claims in pools. Ginnie Mae has clearly signaled that the agency prefers this outcome by releasing the APM and its associated commentary. But the risk remains that a servicer might choose to buyout loans even though the economics are significantly worse than before. For example, maybe they pocket a portion of the premium by selling the delinquent MSR to a bank, to take advantage of the bank’s funding advantage.
Trade implications
Hedging the buyout risk in pools with a large percentage of delinquent loans is challenging. The uncertainty regarding the magnitude and timing of buyouts is likely to weigh on prices for these pools. At the same time, the pools with high buyouts will be left with much less uncertainty and should command a pay-up over otherwise similar pools with high delinquency rates.
The most obvious securities to benefit will be the high-buyout lenders’ single issuer pools and securities backed by those pools. This can even include seasoned Ginnie I pools since those banks were active lenders when that program was larger. CMOs backed by this collateral can also benefit from more predictable speeds once the buyouts have passed.
Because the Ginnie Mae market used to be dominated by bank originators seasoned Ginnie Mae multi pools tend to have high shares of these banks’ loans. For example, consider G2 MA0534, the 3.5% multi pool issued in November 2012. Roughly $2.6 billion is outstanding and 37% is serviced by Wells Fargo. The pool’s 60+ delinquency rate fell to 5.3% in July from 6.3% in June. But if Wells had not bought out any loans, the delinquency rate would have increased to 8.2%. In July Wells buyouts are likely to add 10 CPR to the pool’s speeds but the overall delinquency rate is likely to fall close to the pre-COVID level.
For comparison, consider G2 MA5594, the 3.5% multi pool issued in November 2018. Wells and other banks are not a large share of the pool—Wells is only 7%–so the buyout rate was low and the 60+ day delinquency rate increased to 9% in July. Investors in that pool face significantly more prepayment uncertainty than G2 MA0534.
Finally, pools aged one month or less should accumulate far fewer delinquencies than even slightly more seasoned pools since the pace of new delinquencies has slowed. Low WALA pools consequently have a much lower risk of future large buyouts. Low WALA 2.5%s are trading flat to TBA and low WALA 3.0%s are 3/32s to 4/32s over TBA.
This material is intended only for institutional investors and does not carry all of the independence and disclosure standards of retail debt research reports. In the preparation of this material, the author may have consulted or otherwise discussed the matters referenced herein with one or more of SCM’s trading desks, any of which may have accumulated or otherwise taken a position, long or short, in any of the financial instruments discussed in or related to this material. Further, SCM may act as a market maker or principal dealer and may have proprietary interests that differ or conflict with the recipient hereof, in connection with any financial instrument discussed in or related to this material.
This message, including any attachments or links contained herein, is subject to important disclaimers, conditions, and disclosures regarding Electronic Communications, which you can find at https://portfolio-strategy.apsec.com/sancap-disclaimers-and-disclosures.
Important Disclaimers
Copyright © 2026 Santander US Capital Markets LLC and its affiliates (“SCM”). All rights reserved. SCM is a member of FINRA and SIPC. This material is intended for limited distribution to institutions only and is not publicly available. Any unauthorized use or disclosure is prohibited.
In making this material available, SCM (i) is not providing any advice to the recipient, including, without limitation, any advice as to investment, legal, accounting, tax and financial matters, (ii) is not acting as an advisor or fiduciary in respect of the recipient, (iii) is not making any predictions or projections and (iv) intends that any recipient to which SCM has provided this material is an “institutional investor” (as defined under applicable law and regulation, including FINRA Rule 4512 and that this material will not be disseminated, in whole or part, to any third party by the recipient.
The author of this material is an economist, desk strategist or trader. In the preparation of this material, the author may have consulted or otherwise discussed the matters referenced herein with one or more of SCM’s trading desks, any of which may have accumulated or otherwise taken a position, long or short, in any of the financial instruments discussed in or related to this material. Further, SCM or any of its affiliates may act as a market maker or principal dealer and may have proprietary interests that differ or conflict with the recipient hereof, in connection with any financial instrument discussed in or related to this material.
This material (i) has been prepared for information purposes only and does not constitute a solicitation or an offer to buy or sell any securities, related investments or other financial instruments, (ii) is neither research, a “research report” as commonly understood under the securities laws and regulations promulgated thereunder nor the product of a research department, (iii) or parts thereof may have been obtained from various sources, the reliability of which has not been verified and cannot be guaranteed by SCM, (iv) should not be reproduced or disclosed to any other person, without SCM’s prior consent and (v) is not intended for distribution in any jurisdiction in which its distribution would be prohibited.
In connection with this material, SCM (i) makes no representation or warranties as to the appropriateness or reliance for use in any transaction or as to the permissibility or legality of any financial instrument in any jurisdiction, (ii) believes the information in this material to be reliable, has not independently verified such information and makes no representation, express or implied, with regard to the accuracy or completeness of such information, (iii) accepts no responsibility or liability as to any reliance placed, or investment decision made, on the basis of such information by the recipient and (iv) does not undertake, and disclaims any duty to undertake, to update or to revise the information contained in this material.
Unless otherwise stated, the views, opinions, forecasts, valuations, or estimates contained in this material are those solely of the author, as of the date of publication of this material, and are subject to change without notice. The recipient of this material should make an independent evaluation of this information and make such other investigations as the recipient considers necessary (including obtaining independent financial advice), before transacting in any financial market or instrument discussed in or related to this material.
Important disclaimers for clients in the EU and UK
This publication has been prepared by Trading Desk Strategists within the Sales and Trading functions of Santander US Capital Markets LLC (“SanCap”), the US registered broker-dealer of Santander Corporate & Investment Banking. This communication is distributed in the EEA by Banco Santander S.A., a credit institution registered in Spain and authorised and regulated by the Bank of Spain and the CNMV. Any EEA recipient of this communication that would like to affect any transaction in any security or issuer discussed herein should do so with Banco Santander S.A. or any of its affiliates (together “Santander”). This communication has been distributed in the UK by Banco Santander, S.A.’s London branch, authorised by the Bank of Spain and subject to regulatory oversight on certain matters by the Financial Conduct Authority (FCA) and the Prudential Regulation Authority (PRA).
The publication is intended for exclusive use for Professional Clients and Eligible Counterparties as defined by MiFID II and is not intended for use by retail customers or for any persons or entities in any jurisdictions or country where such distribution or use would be contrary to local law or regulation.
This material is not a product of Santander´s Research Team and does not constitute independent investment research. This is a marketing communication and may contain ¨investment recommendations¨ as defined by the Market Abuse Regulation 596/2014 ("MAR"). This publication has not been prepared in accordance with legal requirements designed to promote the independence of research and is not subject to any prohibition on dealing ahead of the dissemination of investment research. The author, date and time of the production of this publication are as indicated herein.
This publication does not constitute investment advice and may not be relied upon to form an investment decision, nor should it be construed as any offer to sell or issue or invitation to purchase, acquire or subscribe for any instruments referred herein. The publication has been prepared in good faith and based on information Santander considers reliable as of the date of publication, but Santander does not guarantee or represent, express or implied, that such information is accurate or complete. All estimates, forecasts and opinions are current as at the date of this publication and are subject to change without notice. Unless otherwise indicated, Santander does not intend to update this publication. The views and commentary in this publication may not be objective or independent of the interests of the Trading and Sales functions of Santander, who may be active participants in the markets, investments or strategies referred to herein and/or may receive compensation from investment banking and non-investment banking services from entities mentioned herein. Santander may trade as principal, make a market or hold positions in instruments (or related derivatives) and/or hold financial interest in entities discussed herein. Santander may provide market commentary or trading strategies to other clients or engage in transactions which may differ from views expressed herein. Santander may have acted upon the contents of this publication prior to you having received it.
This publication is intended for the exclusive use of the recipient and must not be reproduced, redistributed or transmitted, in whole or in part, without Santander’s consent. The recipient agrees to keep confidential at all times information contained herein.


