Uncategorized
Managers ride the leveraged loan rally through June
admin | July 10, 2020
This material is a Marketing Communication and does not constitute Independent Investment Research.
The rally in the leveraged loan market from April to June has helped more than 55% of CLO managers outperform the broad market. The average CLO loan portfolio gained 1.7% and, after adjusting for broad market exposure, or beta, outperformed the market by 0.1%. Managers who carried portfolios with stronger loans and had better track records at the end of March delivered more excess returns than their peers in the ensuing three months. Managers whose deals originated in 2019 also tended to deliver significantly better returns in the market between April and June.
Loan returns rose sharply in April then plateaued in early May before picking up the pace in June (Exhibit 1). The Index has now reached about 95% of its pre-coronavirus level. After accounting for the various reporting dates of managers, the S&P/LSTA Index gained 1.7% between April and June. These managers held portfolios with an average beta of 1.03, which meant the average manager should have gained 1.8%. With the actual average performance at 1.9%, the average manager outperformed the index by 0.1%.
Exhibit 1: Loan returns have recovered 95% of pre-Covid level
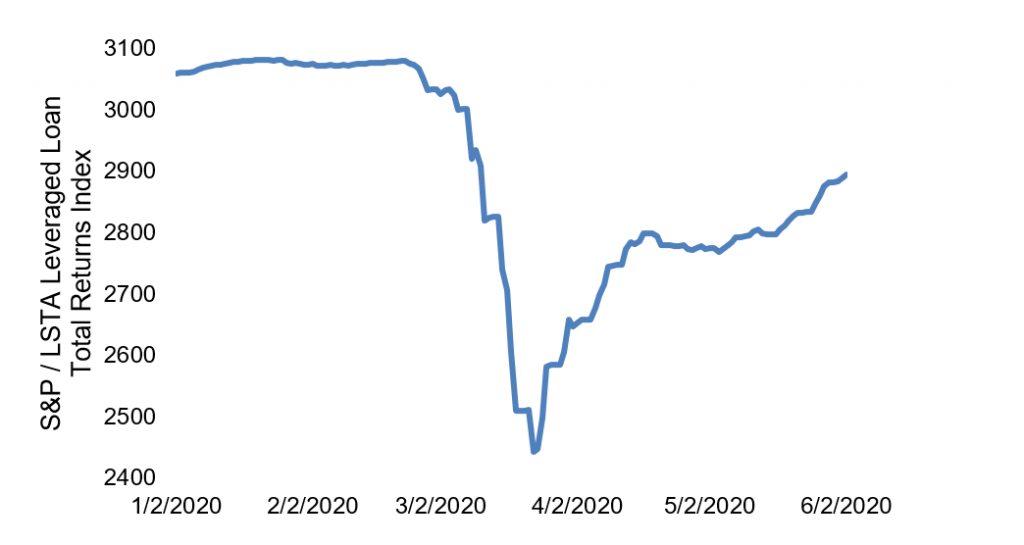
Source: Bloomberg, Amherst Pierpont Securities
More than 55% of the managers outperformed the index, a small uptick from the figures reported by APS last month (Exhibit 2). Out of those managers, 15% delivered alphas higher than 1%. The managers who lagged the index saw a greater dispersion. Over 35% of the managers trailed the index by at least 1%.
Exhibit 2: More than half of the managers outperformed the index between April and June
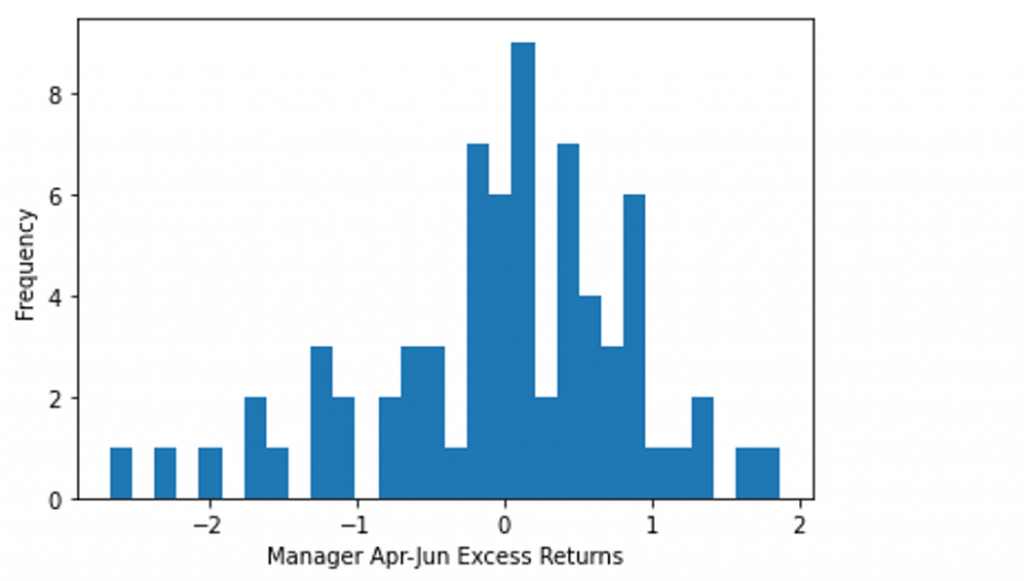
Note: data shows excess return only for active deals. Source: Amherst Pierpont Securities.
The weighted loan price and the bid depth of the portfolios correlated most highly with recent excess returns (Exhibit 3). Managers who held higher priced and more liquid loans tended to deliver more excess returns. Additionally, lower weighted average spread, lower exposure to ‘Caa1’ and defaulted loans, and a track record of outperforming the broad market also correlated with more excess returns. Exposure to sectors most vulnerable during the pandemic, such as retail, energy, and hotel, only had moderate relationships with recent excess returns.
Exhibit 3: Correlation of portfolio or manager features with recent excess return
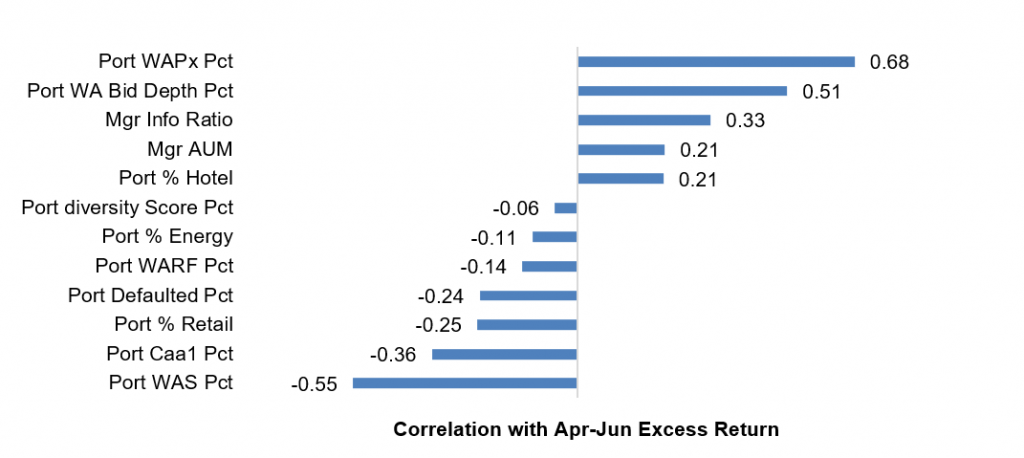
Note: data shows the correlation of manager or loan portfolio attribute with managers’ excess return or alpha from April through June only on active deals. Portfolio attributes measured as percentiles. Source: Amherst Pierpont Securities.
Managers whose deals originated in 2019 also delivered notably more excess returns on average (Exhibit 4). On the other hand, managers whose deals first started in 2015 or prior barely performed in line with its peers between April and June. Deals of vintage 2015 or prior saw worsening credit amid the energy crisis of 2016 and became especially vulnerable during the pandemic.
Exhibit 4: Deals of newer vintage tended to show more excess returns
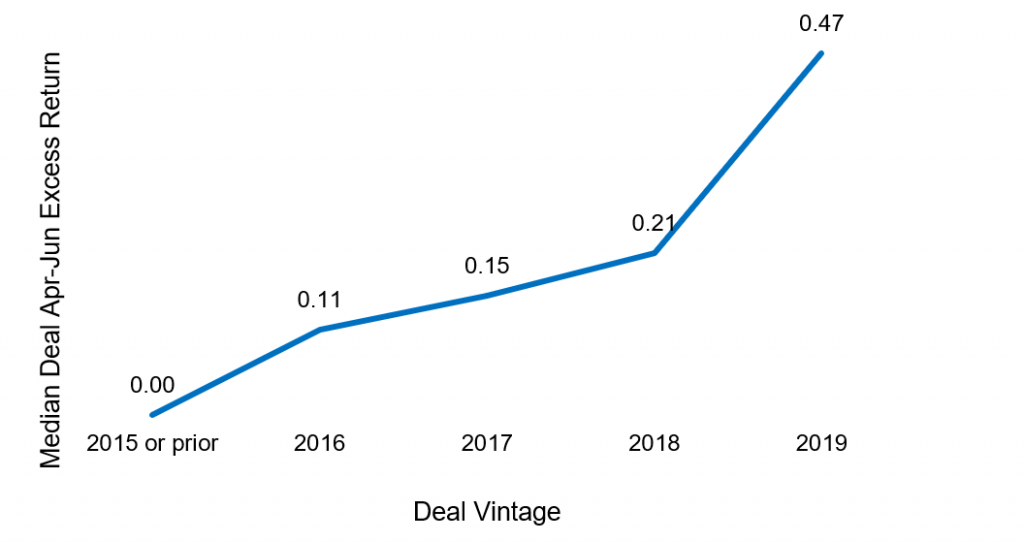
Source: Bloomberg, Amherst Pierpont Securities
The following managers delivered positive alpha in the market between April and June (Exhibit 5). Palmer Square ranked in the top five according to APS reports since March and stayed ahead this time. The others include Goldentree, Halcyon, PineBridge, Prudential, and Octagon.
Exhibit 5: Alpha leaders in CLO portfolio performance April-June 2020
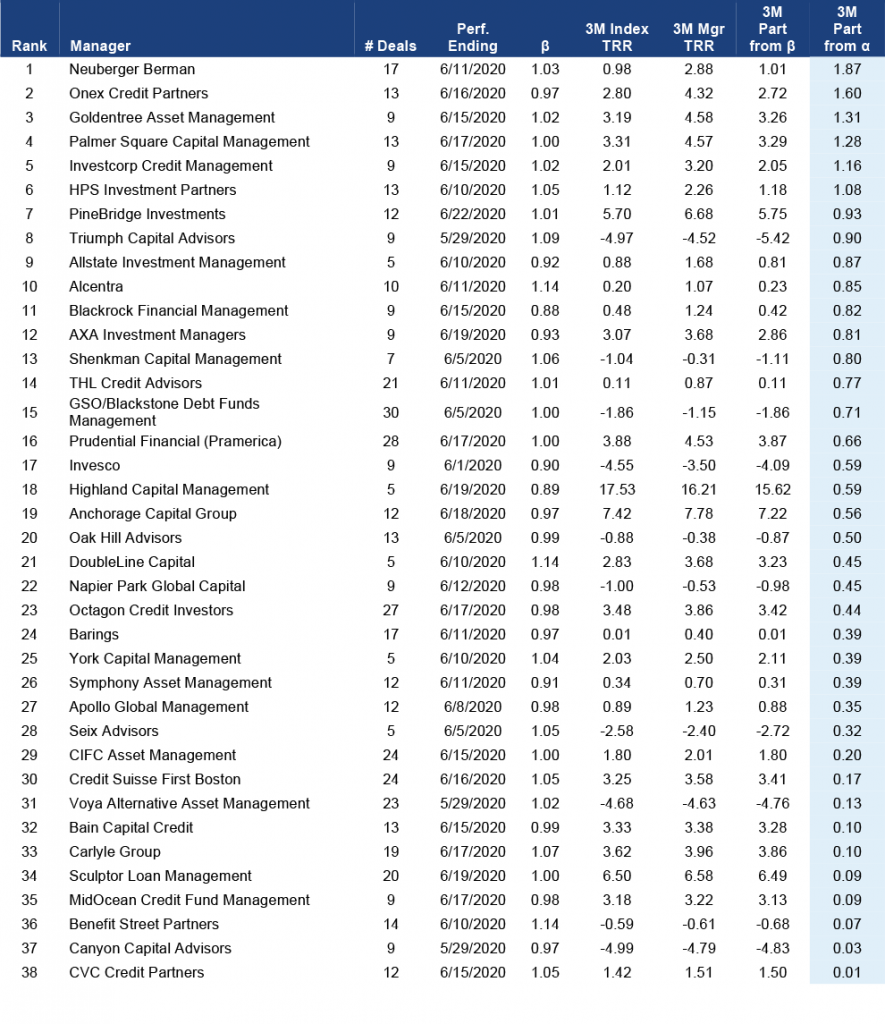
Note: Performance for managers with five or more deals tracked by APS. Performance attribution starts with calculated total return on the leveraged loan portfolio held in each CLO for the 3-month reporting period ending on the indicated date. CLOs, even with a single manager platform, may vary in reporting period. The analysis matches performance in each period to performance over the identical period in the S&P/LSTA Leveraged Loan Index. Where a deal has at least 18 months of performance history since pricing and no apparent errors in cash flow data, the analysis calculates a deal beta. The deal beta is multiplied by the index return to predict deal return attributable to broad market performance. Where no beta can be calculated, the analysis uses the average beta across each manager’s active deals weighted by the average deal principal balance over time. Any difference between performance attributable to beta and actual performance is attributed to manager alpha. Source: Amherst Pierpont Securities.
This material is intended only for institutional investors and does not carry all of the independence and disclosure standards of retail debt research reports. In the preparation of this material, the author may have consulted or otherwise discussed the matters referenced herein with one or more of SCM’s trading desks, any of which may have accumulated or otherwise taken a position, long or short, in any of the financial instruments discussed in or related to this material. Further, SCM may act as a market maker or principal dealer and may have proprietary interests that differ or conflict with the recipient hereof, in connection with any financial instrument discussed in or related to this material.
This message, including any attachments or links contained herein, is subject to important disclaimers, conditions, and disclosures regarding Electronic Communications, which you can find at https://portfolio-strategy.apsec.com/sancap-disclaimers-and-disclosures.
Important Disclaimers
Copyright © 2026 Santander US Capital Markets LLC and its affiliates (“SCM”). All rights reserved. SCM is a member of FINRA and SIPC. This material is intended for limited distribution to institutions only and is not publicly available. Any unauthorized use or disclosure is prohibited.
In making this material available, SCM (i) is not providing any advice to the recipient, including, without limitation, any advice as to investment, legal, accounting, tax and financial matters, (ii) is not acting as an advisor or fiduciary in respect of the recipient, (iii) is not making any predictions or projections and (iv) intends that any recipient to which SCM has provided this material is an “institutional investor” (as defined under applicable law and regulation, including FINRA Rule 4512 and that this material will not be disseminated, in whole or part, to any third party by the recipient.
The author of this material is an economist, desk strategist or trader. In the preparation of this material, the author may have consulted or otherwise discussed the matters referenced herein with one or more of SCM’s trading desks, any of which may have accumulated or otherwise taken a position, long or short, in any of the financial instruments discussed in or related to this material. Further, SCM or any of its affiliates may act as a market maker or principal dealer and may have proprietary interests that differ or conflict with the recipient hereof, in connection with any financial instrument discussed in or related to this material.
This material (i) has been prepared for information purposes only and does not constitute a solicitation or an offer to buy or sell any securities, related investments or other financial instruments, (ii) is neither research, a “research report” as commonly understood under the securities laws and regulations promulgated thereunder nor the product of a research department, (iii) or parts thereof may have been obtained from various sources, the reliability of which has not been verified and cannot be guaranteed by SCM, (iv) should not be reproduced or disclosed to any other person, without SCM’s prior consent and (v) is not intended for distribution in any jurisdiction in which its distribution would be prohibited.
In connection with this material, SCM (i) makes no representation or warranties as to the appropriateness or reliance for use in any transaction or as to the permissibility or legality of any financial instrument in any jurisdiction, (ii) believes the information in this material to be reliable, has not independently verified such information and makes no representation, express or implied, with regard to the accuracy or completeness of such information, (iii) accepts no responsibility or liability as to any reliance placed, or investment decision made, on the basis of such information by the recipient and (iv) does not undertake, and disclaims any duty to undertake, to update or to revise the information contained in this material.
Unless otherwise stated, the views, opinions, forecasts, valuations, or estimates contained in this material are those solely of the author, as of the date of publication of this material, and are subject to change without notice. The recipient of this material should make an independent evaluation of this information and make such other investigations as the recipient considers necessary (including obtaining independent financial advice), before transacting in any financial market or instrument discussed in or related to this material.
Important disclaimers for clients in the EU and UK
This publication has been prepared by Trading Desk Strategists within the Sales and Trading functions of Santander US Capital Markets LLC (“SanCap”), the US registered broker-dealer of Santander Corporate & Investment Banking. This communication is distributed in the EEA by Banco Santander S.A., a credit institution registered in Spain and authorised and regulated by the Bank of Spain and the CNMV. Any EEA recipient of this communication that would like to affect any transaction in any security or issuer discussed herein should do so with Banco Santander S.A. or any of its affiliates (together “Santander”). This communication has been distributed in the UK by Banco Santander, S.A.’s London branch, authorised by the Bank of Spain and subject to regulatory oversight on certain matters by the Financial Conduct Authority (FCA) and the Prudential Regulation Authority (PRA).
The publication is intended for exclusive use for Professional Clients and Eligible Counterparties as defined by MiFID II and is not intended for use by retail customers or for any persons or entities in any jurisdictions or country where such distribution or use would be contrary to local law or regulation.
This material is not a product of Santander´s Research Team and does not constitute independent investment research. This is a marketing communication and may contain ¨investment recommendations¨ as defined by the Market Abuse Regulation 596/2014 ("MAR"). This publication has not been prepared in accordance with legal requirements designed to promote the independence of research and is not subject to any prohibition on dealing ahead of the dissemination of investment research. The author, date and time of the production of this publication are as indicated herein.
This publication does not constitute investment advice and may not be relied upon to form an investment decision, nor should it be construed as any offer to sell or issue or invitation to purchase, acquire or subscribe for any instruments referred herein. The publication has been prepared in good faith and based on information Santander considers reliable as of the date of publication, but Santander does not guarantee or represent, express or implied, that such information is accurate or complete. All estimates, forecasts and opinions are current as at the date of this publication and are subject to change without notice. Unless otherwise indicated, Santander does not intend to update this publication. The views and commentary in this publication may not be objective or independent of the interests of the Trading and Sales functions of Santander, who may be active participants in the markets, investments or strategies referred to herein and/or may receive compensation from investment banking and non-investment banking services from entities mentioned herein. Santander may trade as principal, make a market or hold positions in instruments (or related derivatives) and/or hold financial interest in entities discussed herein. Santander may provide market commentary or trading strategies to other clients or engage in transactions which may differ from views expressed herein. Santander may have acted upon the contents of this publication prior to you having received it.
This publication is intended for the exclusive use of the recipient and must not be reproduced, redistributed or transmitted, in whole or in part, without Santander’s consent. The recipient agrees to keep confidential at all times information contained herein.


