Uncategorized
Buyouts drive up Ginnie Mae speeds sharply
admin | July 10, 2020
This material is a Marketing Communication and does not constitute Independent Investment Research.
Efforts by Ginnie Mae servicers to buy loans in forbearance out of MBS, cure them and eventually repool them likely drove up the agencies prepayment speeds sharply in June. Speeds in Ginnie Mae I programs jumped month-over-month by 118% and in Ginnie Mae II by 44%. Bank servicers likely played a leading role. Speeds in Fannie Mae and Freddie Mac MBS also came in slightly faster than expectation, likely lifted by processing lags and possibly by increased use of appraisal waivers.
Ginnie Mae speeds explode
Ginnie Mae’s prepayment speeds exploded higher in June, almost certainly due to buyouts. Ginnie I pools jumped 118% overall and more than 100% across the stack. Ginnie II speeds increased 44% overall and most coupons increased between 40% and 50%. Buyouts were far greater in seasoned vintages, likely because far more of those loans are serviced by banks. For example, the 2017 3.5%s increased 35.1% and had 13.1% of its loans in forbearance as of June 1, while the 2013 3.5%s increased 129.4% while only 10.2% of its loans were in forbearance. The Ginnie I program consists primarily of seasoned pools, which explains why its prepayment speeds increased so much more.
CARES Act forbearance programs have created new incentives for servicers to buy out FHA loans from Ginnie Mae MBS. Ginnie Mae rules allow servicers to buy out loans after three months of missed payments. Loans in forbearance qualify. Since FHA rules allow servicers to cure loans in forbearance simply by deferring missed payments to the end of the loan, it becomes profitable for servicers to buy out loans at par, cure and quickly repool the loans at premium prices. Profits are particularly high for banks with a low cost of funds for financing loans until repooling.
Fannie Mae and Freddie Mac print faster than expected
Fannie Mae’s and Freddie Mac’s 30-year prepayment speeds came in higher than expected for the third straight month, although by a much smaller margin than before. Fannie Mae’s 30-year speeds increased 14% and Freddie Mac’s speeds increased 13%, in contrast to the consensus prediction of a 5% increase. Amherst Pierpont had predicted roughly flat speeds, anticipating that that the surge in refis in March had finally worked its way through the pipeline. This would offset any increase in speeds from two additional business days and a rebound in housing turnover. Longer lags from application to closing were still the most likely reason for faster speeds. For example, some April applications likely closed in June. But the impact was much smaller, and is likely to decline further in the coming months.
Some of the additional conventional speed may be coming from increasing use of appraisal waivers for refinancing Fannie Mae and Freddie Mac loans. The Covid crisis has made traditional appraisals more difficult in many markets, and Fannie Mae and Freddie Mac likely feel increasingly inclined to grant waivers in those markets, particularly for loans with enough amortization to build up their LTV since origination.
Looking ahead
Conventional prepayment speeds should increase another 10% in July as lagged mortgage rates fall another 5 bp and turnover continues to increase, while day count remains the same. Speeds should increase another 5% in August as refis continue to pickup, although the full increase is lower since August has one fewer business day.
Ginnie Mae prepayments could face a second round of buyouts from bank servicers as another batch of loans delinquent due to Covid-19 become buyout-eligible for the first time. The risk of buyouts from non-bank servicers is likely much lower due to Ginnie Mae’s new pooling restrictions that took effect July 1, but the rules may do little to deter banks from continuing their buyouts.
Exhibit 1: Ginnie Mae speeds surged faster from buyouts by banks
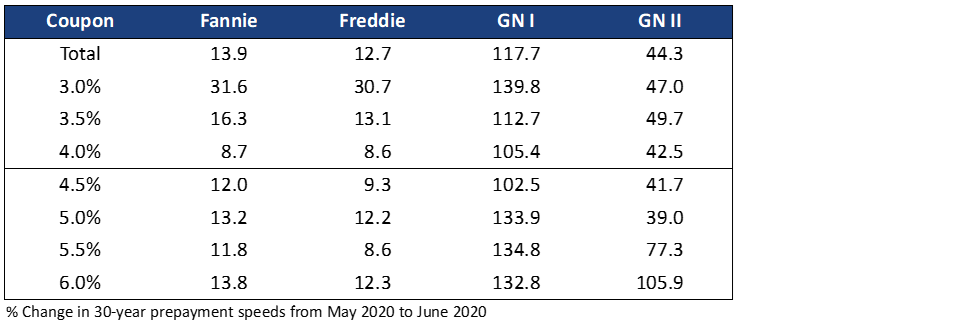
Source: Fannie Mae, Freddie Mac, Ginnie Mae, eMBS, Amherst Pierpont Securities
Data Tables
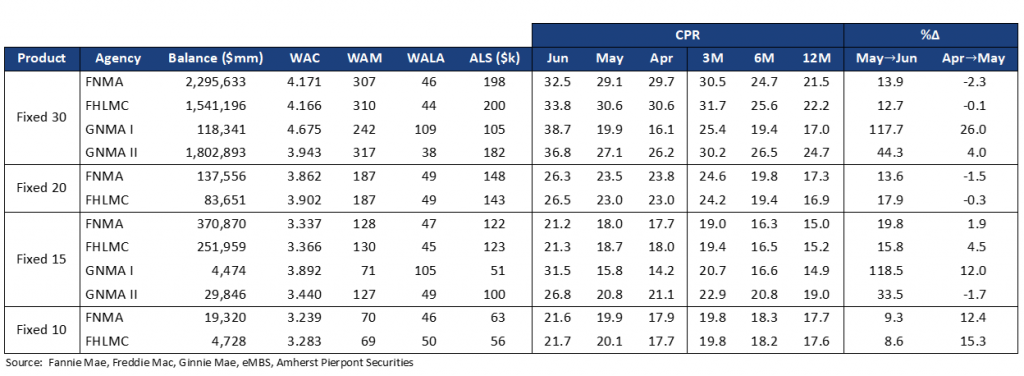
Exhibit 2: Prepayment Summary
Our short term forecast is shown in Exhibit 5 (Fannie Mae) and Exhibit 6 (Freddie Mac). Exhibit 4 shows the static rates used in the prepayment forecast.
Exhibit 3: Agency Speeds, Largest Cohorts
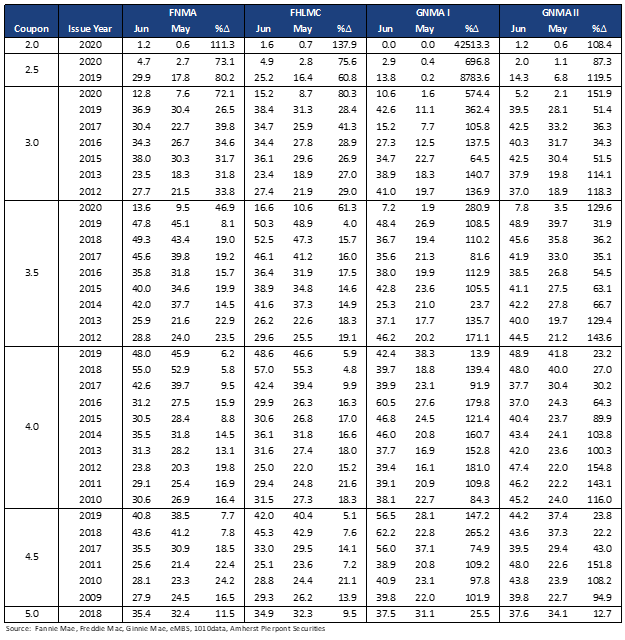
Exhibit 4: Mortgage Rate Forecast
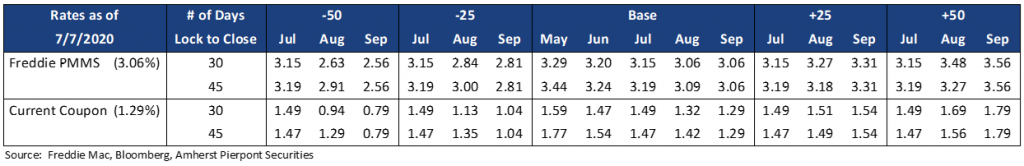
Exhibit 5: Fannie Mae Short Term Forecast
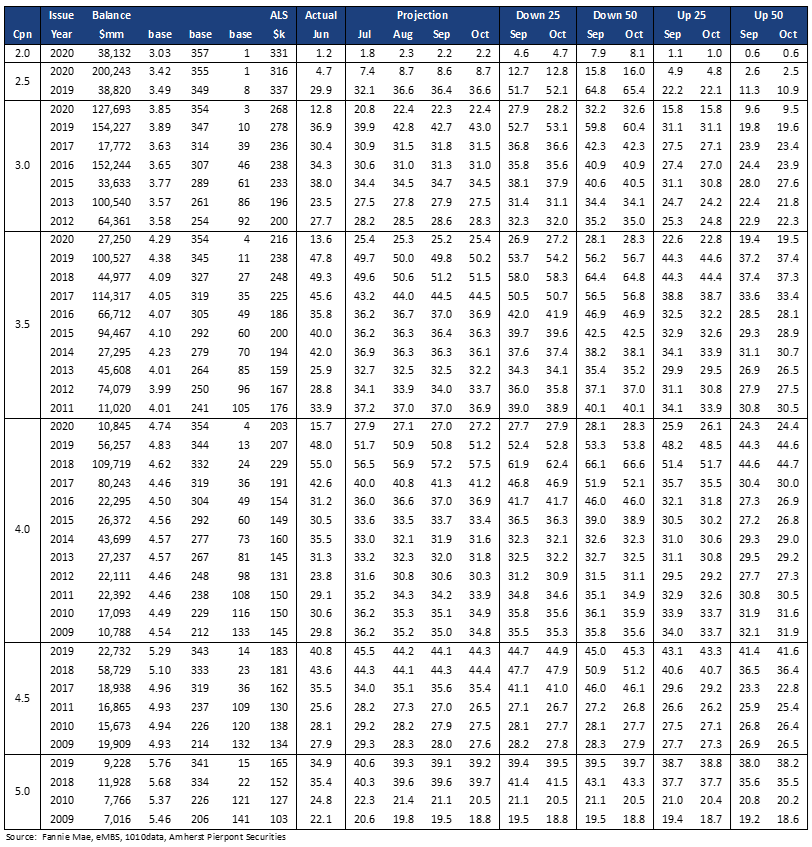
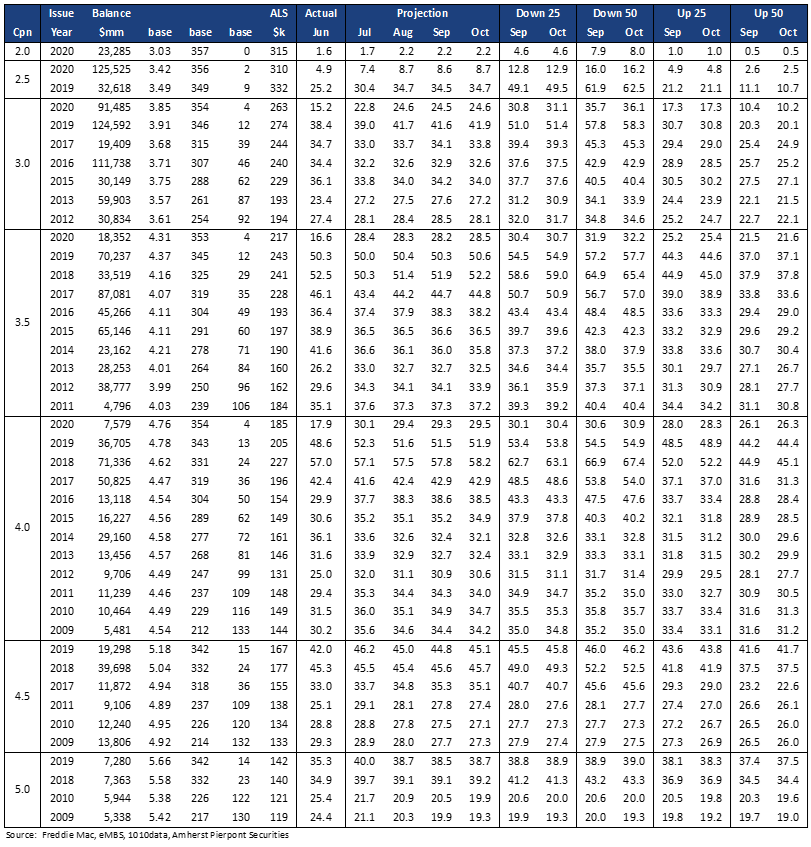
Exhibit 6: Freddie Mac Short Term Forecast
This material is intended only for institutional investors and does not carry all of the independence and disclosure standards of retail debt research reports. In the preparation of this material, the author may have consulted or otherwise discussed the matters referenced herein with one or more of SCM’s trading desks, any of which may have accumulated or otherwise taken a position, long or short, in any of the financial instruments discussed in or related to this material. Further, SCM may act as a market maker or principal dealer and may have proprietary interests that differ or conflict with the recipient hereof, in connection with any financial instrument discussed in or related to this material.
This message, including any attachments or links contained herein, is subject to important disclaimers, conditions, and disclosures regarding Electronic Communications, which you can find at https://portfolio-strategy.apsec.com/sancap-disclaimers-and-disclosures.
Important Disclaimers
Copyright © 2026 Santander US Capital Markets LLC and its affiliates (“SCM”). All rights reserved. SCM is a member of FINRA and SIPC. This material is intended for limited distribution to institutions only and is not publicly available. Any unauthorized use or disclosure is prohibited.
In making this material available, SCM (i) is not providing any advice to the recipient, including, without limitation, any advice as to investment, legal, accounting, tax and financial matters, (ii) is not acting as an advisor or fiduciary in respect of the recipient, (iii) is not making any predictions or projections and (iv) intends that any recipient to which SCM has provided this material is an “institutional investor” (as defined under applicable law and regulation, including FINRA Rule 4512 and that this material will not be disseminated, in whole or part, to any third party by the recipient.
The author of this material is an economist, desk strategist or trader. In the preparation of this material, the author may have consulted or otherwise discussed the matters referenced herein with one or more of SCM’s trading desks, any of which may have accumulated or otherwise taken a position, long or short, in any of the financial instruments discussed in or related to this material. Further, SCM or any of its affiliates may act as a market maker or principal dealer and may have proprietary interests that differ or conflict with the recipient hereof, in connection with any financial instrument discussed in or related to this material.
This material (i) has been prepared for information purposes only and does not constitute a solicitation or an offer to buy or sell any securities, related investments or other financial instruments, (ii) is neither research, a “research report” as commonly understood under the securities laws and regulations promulgated thereunder nor the product of a research department, (iii) or parts thereof may have been obtained from various sources, the reliability of which has not been verified and cannot be guaranteed by SCM, (iv) should not be reproduced or disclosed to any other person, without SCM’s prior consent and (v) is not intended for distribution in any jurisdiction in which its distribution would be prohibited.
In connection with this material, SCM (i) makes no representation or warranties as to the appropriateness or reliance for use in any transaction or as to the permissibility or legality of any financial instrument in any jurisdiction, (ii) believes the information in this material to be reliable, has not independently verified such information and makes no representation, express or implied, with regard to the accuracy or completeness of such information, (iii) accepts no responsibility or liability as to any reliance placed, or investment decision made, on the basis of such information by the recipient and (iv) does not undertake, and disclaims any duty to undertake, to update or to revise the information contained in this material.
Unless otherwise stated, the views, opinions, forecasts, valuations, or estimates contained in this material are those solely of the author, as of the date of publication of this material, and are subject to change without notice. The recipient of this material should make an independent evaluation of this information and make such other investigations as the recipient considers necessary (including obtaining independent financial advice), before transacting in any financial market or instrument discussed in or related to this material.
Important disclaimers for clients in the EU and UK
This publication has been prepared by Trading Desk Strategists within the Sales and Trading functions of Santander US Capital Markets LLC (“SanCap”), the US registered broker-dealer of Santander Corporate & Investment Banking. This communication is distributed in the EEA by Banco Santander S.A., a credit institution registered in Spain and authorised and regulated by the Bank of Spain and the CNMV. Any EEA recipient of this communication that would like to affect any transaction in any security or issuer discussed herein should do so with Banco Santander S.A. or any of its affiliates (together “Santander”). This communication has been distributed in the UK by Banco Santander, S.A.’s London branch, authorised by the Bank of Spain and subject to regulatory oversight on certain matters by the Financial Conduct Authority (FCA) and the Prudential Regulation Authority (PRA).
The publication is intended for exclusive use for Professional Clients and Eligible Counterparties as defined by MiFID II and is not intended for use by retail customers or for any persons or entities in any jurisdictions or country where such distribution or use would be contrary to local law or regulation.
This material is not a product of Santander´s Research Team and does not constitute independent investment research. This is a marketing communication and may contain ¨investment recommendations¨ as defined by the Market Abuse Regulation 596/2014 ("MAR"). This publication has not been prepared in accordance with legal requirements designed to promote the independence of research and is not subject to any prohibition on dealing ahead of the dissemination of investment research. The author, date and time of the production of this publication are as indicated herein.
This publication does not constitute investment advice and may not be relied upon to form an investment decision, nor should it be construed as any offer to sell or issue or invitation to purchase, acquire or subscribe for any instruments referred herein. The publication has been prepared in good faith and based on information Santander considers reliable as of the date of publication, but Santander does not guarantee or represent, express or implied, that such information is accurate or complete. All estimates, forecasts and opinions are current as at the date of this publication and are subject to change without notice. Unless otherwise indicated, Santander does not intend to update this publication. The views and commentary in this publication may not be objective or independent of the interests of the Trading and Sales functions of Santander, who may be active participants in the markets, investments or strategies referred to herein and/or may receive compensation from investment banking and non-investment banking services from entities mentioned herein. Santander may trade as principal, make a market or hold positions in instruments (or related derivatives) and/or hold financial interest in entities discussed herein. Santander may provide market commentary or trading strategies to other clients or engage in transactions which may differ from views expressed herein. Santander may have acted upon the contents of this publication prior to you having received it.
This publication is intended for the exclusive use of the recipient and must not be reproduced, redistributed or transmitted, in whole or in part, without Santander’s consent. The recipient agrees to keep confidential at all times information contained herein.


