


Uncategorized
Dusting off the not-so-old playbooks
admin | June 19, 2020
This material is a Marketing Communication and does not constitute Independent Investment Research.
Low rates and elevated credit risk look likely to change the way banks, insurers and asset managers run their portfolios for the next few years. Banks and insurers already face new profit pressures. Asset managers will likely face new pressure on fees. All will have incentives to take on more risk in the portfolios they manage. Many of these investors are back on familiar ground. It’s time to take out the post-crisis playbook.
Bank playbook: duration
Banks have already reported a difficult first quarter with the rest of the year likely to continue the trend. Net income fell from the year before by nearly 70% (Exhibit 1). Almost the entire drop came from surging loan loss reserves, up from the year before by nearly 280%. Interest income from fees and other non-interest sources rose a little while net interest from loans and securities fell a little for flat net operating revenue.
Exhibit 1: A 70% YoY drop in 2020Q1 bank earnings may just be the start
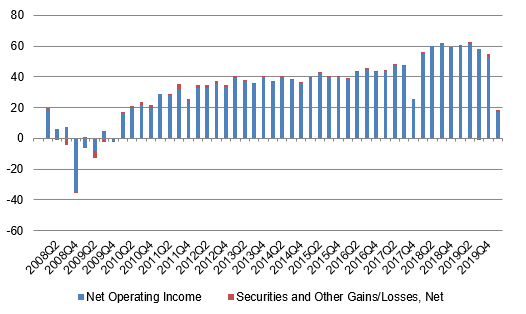
Source: FDIC, Amherst Pierpont Securities
Banks will almost certainly match or exceed their first quarter loan reserves in the second quarter, leaving net operating revenue at the lowest levels since 2008. Bank credit standards across almost all loans have tightened sharply from commercial and industrial, commercial and residential real estate to consumer. Loans look unlikely to help fill the profit hole.
Banks have been here before in the aftermath of 2008 and will likely reach for the old playbook: add duration. From 2008 through 2019, banks steadily added loans and securities with maturities beyond five years (Exhibit 2). Banks at the end of 2008 held 7.2% of total assets in loans and securities with maturities under five years and at the end of 2019 held 7.9% in that bucket. The share in maturities of five years to 15 years went from 10.5% to 14.2%. The share in maturities beyond 15 years went from 9.8% to 13.8%. With the yield curve highly likely to steepen from the impact of QE, forward guidance and fiscal stimulus, this trade should become increasingly compelling for banks.
Exhibit 2: Banks steadily added asset duration after 2008
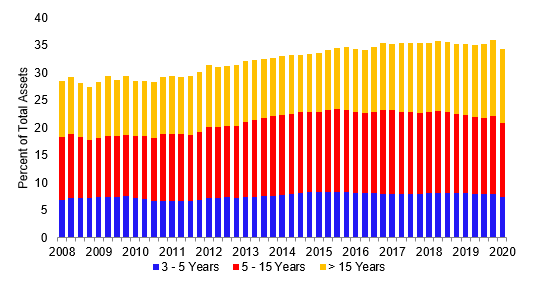
Source: FDIC, Amherst Pierpont Securities
The combination of yield and liquidity is likely to bring most of this action to the agency MBS pass-through market. Post-2008 bank liquidity rules also tilt in favor of pass-throughs. Bank regulators last October relaxed liquidity rules for all but the largest banks, which may encourage some to use CMOs and long agency CMBS to extend duration. Smaller banks may return to familiar territory in long callable muni bonds.
Insurer playbook: credit and liquidity premiums
S&P has estimated that COVID-19 will cost US property and casualty insurers somewhere between $15 billion and $30 billion, at the high end making it the fourth largest US insurance event after hurricanes Katrina, Maria and Irma. Much of that will cover the cost of cancelled events and business disruption. The impact on US life insurers is less immediate and will depend on the ultimate length and severity of the pandemic.
As with banks, prospective losses and low yield put insurers back in familiar territory. P&C insurers typically write short contracts and can eventually raise premiums to offset losses. Life insurers write much longer contracts, including annuities, and are much more sensitive to market moves. Life insurers battled steadily declining net yield on investments after 2008 (Exhibit 3). Insurers without enough investment yield have to draw down reserves to cover liabilities.
Exhibit 3: Life insurers have faced declining investment yields for years
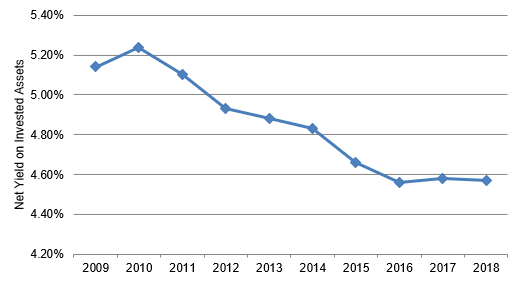
Source: Federal Insurance Office, Amherst Pierpont Securities
The life insurer playbook reaches for credit and illiquid assets. In credit, for example, insurer holdings of ‘BBB’ credit rose from roughly 25% of investment grade exposure in 2008 to 34% at the end of 2019. That allocation fell below the broader investment grade market, but insurers within their ‘BBB’ allocation held an above-market allocation to ‘BBB-‘. Life insurers also steadily allocated to less liquid assets including private bonds, whole mortgage loans and alternative investments (Exhibit 4).
Exhibit 4: Insurers have steadily reached for less liquid assets
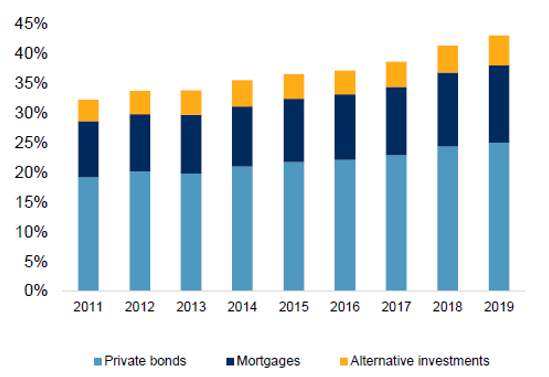
Note: Data shows asset share of total assets. Source: S&P, Amherst Pierpont Securities
Life insurers are likely to get squeezed even more into illiquid assets, especially as the Fed continues to buy investment grade corporate debt. Life insurers have the flexibility to make bespoke private loans to corporate borrowers without access or appetite for public markets and with interest in diversifying away from bank funding. Whole loans also look likely to take a bigger part of life insurance portfolios.
Asset manager playbook: a widening split between passive and active
Asset managers saw historic redemptions in March and have been getting much of the AUM back since, but the split in flows between passive and active is telling. Bond mutual funds, which proxy for active management but often have large passive holdings, lost a historic $255 billion in AUM the last week of March while bond ETFs lost $18 billion. Mutual funds are still down $117 billion for the year while ETFs are up $78 billion, a $195 billion difference. This movie may have a much longer run.
Exhibit 5: Active bond funds, but not ETFs, saw historic redemptions in March
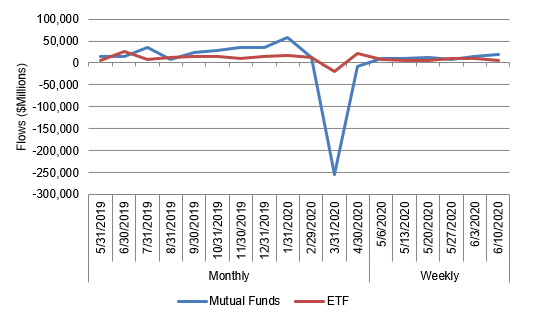
Source: ICI, Amherst Pierpont Securities
Low interest rates will make fees a larger percentage of bond fund yields and likely squeeze fees. Although active managers will argue potential excess return, passive funds will argue for immediate and tangible alpha through lower costs. Lately, passive has been winning.
The playbook for funds is, as it always is, more scale. Bigger is cheaper and better. Passive funds will likely play the role of getting clients in the door for a family of funds with the opportunity to migrate clients to other vehicles eventually.
Fund families without a strong passive vehicle will have to develop expertise in assets and strategies not well suited to the scale investing required for passive funds. Those assets broadly include any out-of-index exposure ranging from assets too small to make it into an index to those too illiquid for daily pricing and liquidity. Those strategies include any that do not fit well in ’40 Act funds, including ones with limited diversification, leverage, redemption notices and the like. Low rates should continue to push the asset management business into two camps of survivors: one with the least expensive beta, and one with the most reliable and diversifying alpha.
* * *
The view in rates
The June FOMC brought the Fed’s economic projections back and confirmed the market’s expectations that the Fed will keep rates near zero through 2022 or beyond. The current 0.69% rate on 10-year Treasury debt implies an average real rate of -61 bp and inflation of 131 bp. Real rates have generally continued to fall and Implied inflation has continued to climb since mid-March. That should keep pressure on the yield curve to steepen from 2-year to 10-year and from 5-year to 30-year. This is a replay of the rate impact of previous episodes of QE.
The view in spreads
The Fed, banks, money market funds and lately fixed income mutual funds all have sizable amounts of money to spend, and their demand for high quality assets should keep squeezing spreads tighter. As spreads tighten in the highest quality assets, investors will have to move to the next tier of higher risk to get sufficient spread, but it is likely to happen. Spread compression across rating categories or credit quality is highly likely. There is fundamental risk in the most leveraged corporate balance sheets, and only there might spreads continue lagging the rest of the market.
The view in credit
Prices on some sectors of leveraged loans, rating agency downgrades in leveraged loans and high yield and rising bank loan loss reserves signal a wave of distressed credit. Rising unemployment and delinquency rates in assets from MBS to auto loans show pressure on the consumer balance sheet. However, monetary and fiscal policies are both shoring up these fundamentals. The course of leveraged corporate and consumer credit also depends on renewal of CARES Act unemployment benefits and support for small businesses, along with moratoriums on eviction and foreclosure.