Uncategorized
Remain defensive; stay overweight less cyclical sectors
admin | June 5, 2020
This material is a Marketing Communication and does not constitute Independent Investment Research.
Investors should remain in a more defensive posture given concerns about the longer-term global economic fallout of the COVID-19 outbreak and related earnings volatility, with the prospect for recurring spikes in volatility over the near-to-intermediate term. The compounded stress on energy/commodity markets is making it extremely difficult to time fluctuations in valuation among commodity credits, which further supports a call to overweight more defensive segments within the Index. With the re-pricing of credit risk year-to-date, the long-term valuation proposition in higher-rated, less cyclical credits and sectors is compelling enough to forego more aggressive strategies that remain susceptible to shorter-term swings in volatility.
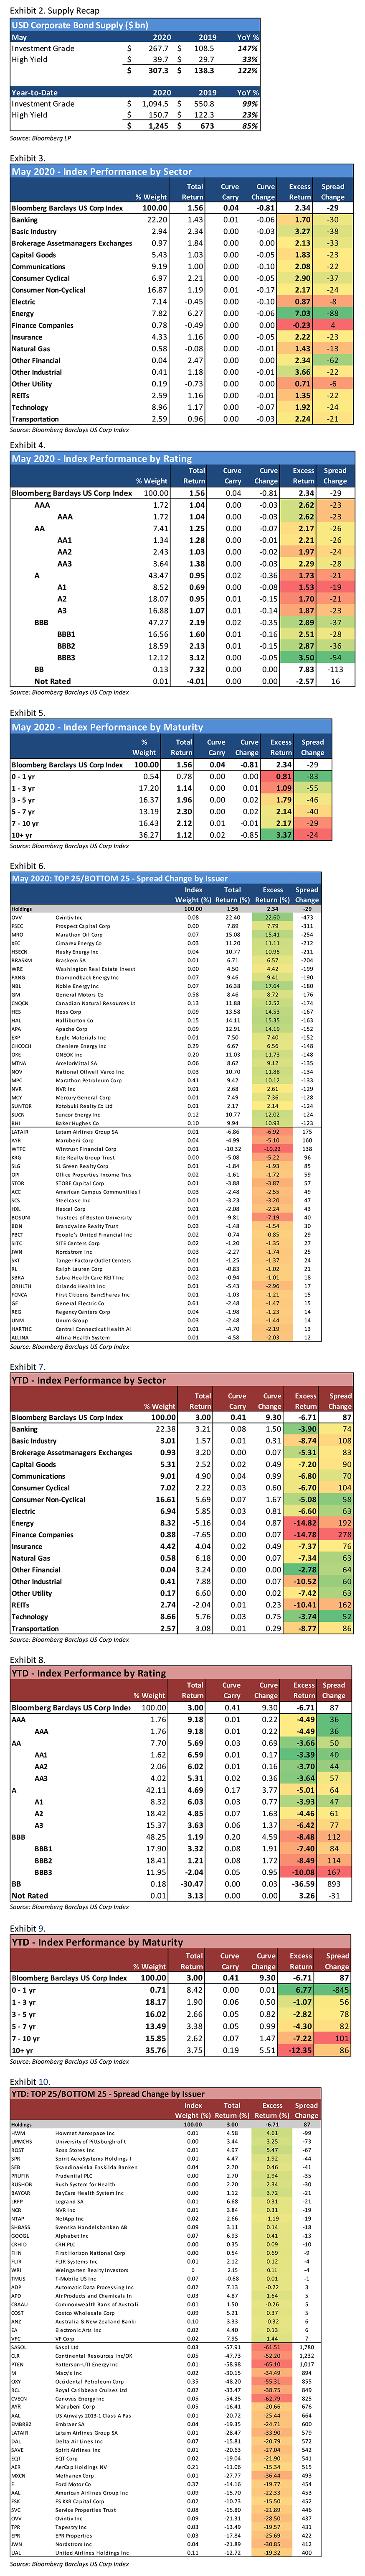
There are no changes to sector recommendations this month. Credit moved pretty much in one direction in May, as the IG Index tightened nearly -30 bp, generating Excess Return of +2.34%, which offset the back-up in Treasuries as Index Total Return finished at +1.56%.
For the second consecutive month, Energy (+7.03 % excess return) provided the highest returns in IG credit, as oil prices continued to recover, with spreads tightening -88 bp in aggregate for the month. The outsized performance in Energy left little room for other segments to shine relative to the Index. Rounding out the top 3 performers were Basic Industry (+3.27%) and Consumer Cyclical (+2.90%), with the rest of the Index either meeting or falling below the Index average.
Exhibit 1. APS Sector Recommendations for June 2020
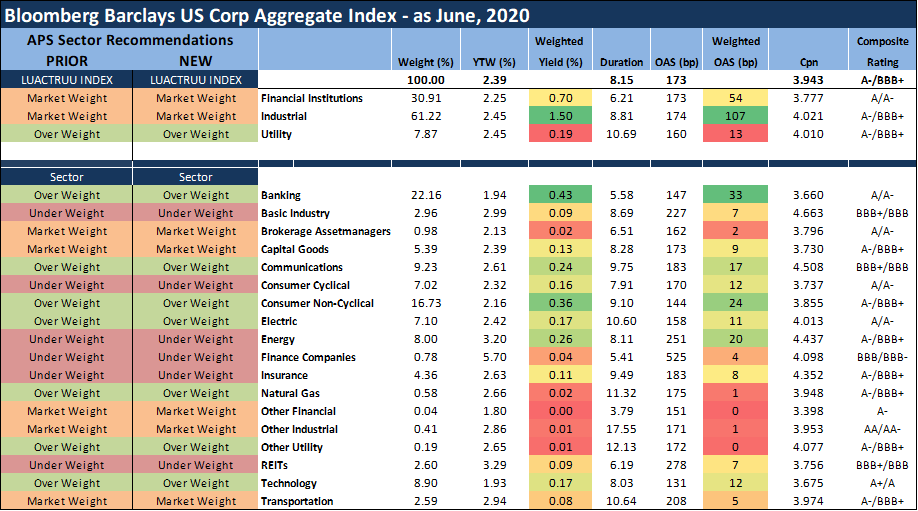
Note: The table provides a summary of how APS expects sectors within the IG Index to perform for the next several months, on an Excess Return basis (total return net of commensurate UST return). These weightings serve as a proxy for how portfolio managers should position their holdings relative to the broad IG corporate bond market. Source: Bloomberg/Barclays US Corp Index, Amherst Pierpont Securities
Credit moved pretty much in one direction in May, as the IG Index tightened nearly -30 bp, generating Excess Return of +2.34%, which offset the back-up in Treasuries as Index Total Return finished at +1.56%.
For the second consecutive month, Energy (+7.03 % excess return) provided the highest returns in IG credit, as oil prices continued to recover, with spreads tightening -88 bp in aggregate for the month. The outsized performance in Energy left little room for other segments to shine relative to the Index. Rounding out the top 3 performers were Basic Industry (+3.27%) and Consumer Cyclical (+2.90%), with the rest of the Index either meeting or falling below the Index average.
Once again, the bottom performances included Finance Companies (-0.23%) and REITs (+1.35%). GE and aircraft lessors remain some of the most stubborn credits to recover in the IG sell-off. Worth noting, however, was AerCap Holdings’ (AER: Baa3*-/BBB/BBB-) successful debt launch this week. AER is highlighted in Exhibit 10 below among the 25 worst performing issuers in the IG Index YTD with +515 bp in aggregate widening as of month-end. The aircraft lessor was placed on review for downgrade by Moody’s this week, along with most other industry peers, threatening its IG status. Nevertheless, AER was able to launch $1.25 billion in 5-year notes at a coupon of 6.75% (down from initial price talk of 8.25%) – an impressive feat emphasizing the market’s renewed appetite for credit risk this week. We believe aircraft leasing companies with the strongest balance sheets and lease portfolio—specifically AER and peer Air Lease (AL: BBB/BBB)—are worthy of focus for investors with higher risk appetites, capable of playing the longer-term recovery. REITs have also been slow to recover as investors maintain their concerns about the longer-term implications for commercial real estate in several of the industry’s subsectors, such as Retail and Office. Utilities (+0.87%) and Banking (+1.70%) were also among the weaker performances in the Index, as investors sought higher yielding opportunities and favored the additional spread available in cyclical, higher-beta segments of the market.
The new issue calendar remained the the most noteworthy story in IG credit, as issuers brought nearly $270 bn in new supply, at a pace of roughly 1.5x the amount seen in 2019 (3 consecutive months of >$250 bn volume). That brought the YTD total north of $1 trillion – roughly twice the volume for the first five months of 2019 and on record pace to surpass any prior year of IG issuance. The Fed’s announcement of the corporate credit facilities (both primary and secondary) in late March continues to backstop a nearly endless stream of funding opportunities for corporate management teams, who are seeking to term out upcoming loans or debt maturities and/or reduce interest expenses with historically low yields available. The month included only two jumbo launches (AT&T and Disney). High Yield added another nearly $40 billion in issuance to the total, and now stands at >20% of prior year volume despite several months of anemic activity to start the year.
This material is intended only for institutional investors and does not carry all of the independence and disclosure standards of retail debt research reports. In the preparation of this material, the author may have consulted or otherwise discussed the matters referenced herein with one or more of SCM’s trading desks, any of which may have accumulated or otherwise taken a position, long or short, in any of the financial instruments discussed in or related to this material. Further, SCM may act as a market maker or principal dealer and may have proprietary interests that differ or conflict with the recipient hereof, in connection with any financial instrument discussed in or related to this material.
This message, including any attachments or links contained herein, is subject to important disclaimers, conditions, and disclosures regarding Electronic Communications, which you can find at https://portfolio-strategy.apsec.com/sancap-disclaimers-and-disclosures.
Important Disclaimers
Copyright © 2026 Santander US Capital Markets LLC and its affiliates (“SCM”). All rights reserved. SCM is a member of FINRA and SIPC. This material is intended for limited distribution to institutions only and is not publicly available. Any unauthorized use or disclosure is prohibited.
In making this material available, SCM (i) is not providing any advice to the recipient, including, without limitation, any advice as to investment, legal, accounting, tax and financial matters, (ii) is not acting as an advisor or fiduciary in respect of the recipient, (iii) is not making any predictions or projections and (iv) intends that any recipient to which SCM has provided this material is an “institutional investor” (as defined under applicable law and regulation, including FINRA Rule 4512 and that this material will not be disseminated, in whole or part, to any third party by the recipient.
The author of this material is an economist, desk strategist or trader. In the preparation of this material, the author may have consulted or otherwise discussed the matters referenced herein with one or more of SCM’s trading desks, any of which may have accumulated or otherwise taken a position, long or short, in any of the financial instruments discussed in or related to this material. Further, SCM or any of its affiliates may act as a market maker or principal dealer and may have proprietary interests that differ or conflict with the recipient hereof, in connection with any financial instrument discussed in or related to this material.
This material (i) has been prepared for information purposes only and does not constitute a solicitation or an offer to buy or sell any securities, related investments or other financial instruments, (ii) is neither research, a “research report” as commonly understood under the securities laws and regulations promulgated thereunder nor the product of a research department, (iii) or parts thereof may have been obtained from various sources, the reliability of which has not been verified and cannot be guaranteed by SCM, (iv) should not be reproduced or disclosed to any other person, without SCM’s prior consent and (v) is not intended for distribution in any jurisdiction in which its distribution would be prohibited.
In connection with this material, SCM (i) makes no representation or warranties as to the appropriateness or reliance for use in any transaction or as to the permissibility or legality of any financial instrument in any jurisdiction, (ii) believes the information in this material to be reliable, has not independently verified such information and makes no representation, express or implied, with regard to the accuracy or completeness of such information, (iii) accepts no responsibility or liability as to any reliance placed, or investment decision made, on the basis of such information by the recipient and (iv) does not undertake, and disclaims any duty to undertake, to update or to revise the information contained in this material.
Unless otherwise stated, the views, opinions, forecasts, valuations, or estimates contained in this material are those solely of the author, as of the date of publication of this material, and are subject to change without notice. The recipient of this material should make an independent evaluation of this information and make such other investigations as the recipient considers necessary (including obtaining independent financial advice), before transacting in any financial market or instrument discussed in or related to this material.
Important disclaimers for clients in the EU and UK
This publication has been prepared by Trading Desk Strategists within the Sales and Trading functions of Santander US Capital Markets LLC (“SanCap”), the US registered broker-dealer of Santander Corporate & Investment Banking. This communication is distributed in the EEA by Banco Santander S.A., a credit institution registered in Spain and authorised and regulated by the Bank of Spain and the CNMV. Any EEA recipient of this communication that would like to affect any transaction in any security or issuer discussed herein should do so with Banco Santander S.A. or any of its affiliates (together “Santander”). This communication has been distributed in the UK by Banco Santander, S.A.’s London branch, authorised by the Bank of Spain and subject to regulatory oversight on certain matters by the Financial Conduct Authority (FCA) and the Prudential Regulation Authority (PRA).
The publication is intended for exclusive use for Professional Clients and Eligible Counterparties as defined by MiFID II and is not intended for use by retail customers or for any persons or entities in any jurisdictions or country where such distribution or use would be contrary to local law or regulation.
This material is not a product of Santander´s Research Team and does not constitute independent investment research. This is a marketing communication and may contain ¨investment recommendations¨ as defined by the Market Abuse Regulation 596/2014 ("MAR"). This publication has not been prepared in accordance with legal requirements designed to promote the independence of research and is not subject to any prohibition on dealing ahead of the dissemination of investment research. The author, date and time of the production of this publication are as indicated herein.
This publication does not constitute investment advice and may not be relied upon to form an investment decision, nor should it be construed as any offer to sell or issue or invitation to purchase, acquire or subscribe for any instruments referred herein. The publication has been prepared in good faith and based on information Santander considers reliable as of the date of publication, but Santander does not guarantee or represent, express or implied, that such information is accurate or complete. All estimates, forecasts and opinions are current as at the date of this publication and are subject to change without notice. Unless otherwise indicated, Santander does not intend to update this publication. The views and commentary in this publication may not be objective or independent of the interests of the Trading and Sales functions of Santander, who may be active participants in the markets, investments or strategies referred to herein and/or may receive compensation from investment banking and non-investment banking services from entities mentioned herein. Santander may trade as principal, make a market or hold positions in instruments (or related derivatives) and/or hold financial interest in entities discussed herein. Santander may provide market commentary or trading strategies to other clients or engage in transactions which may differ from views expressed herein. Santander may have acted upon the contents of this publication prior to you having received it.
This publication is intended for the exclusive use of the recipient and must not be reproduced, redistributed or transmitted, in whole or in part, without Santander’s consent. The recipient agrees to keep confidential at all times information contained herein.


