


Uncategorized
Searching the web for forbearance, and finding it
admin | May 29, 2020
This document is intended for institutional investors and is not subject to all of the independence and disclosure standards applicable to debt research reports prepared for retail investors. This material does not constitute research.
The MBA has done a good job of providing weekly updates on forbearance, but investors may have another useful window into the mind of the borrower: Google. Google search activity for terms related to forbearance track the MBA survey closely and is available almost two weeks in advance of the MBA’s report. That activity currently suggests consumer interest in forbearance has fallen sharply and that new forbearance is heavily front-loaded. At the current rate, overall forbearance could reach roughly 11% in July, which might prove to be the peak if many borrowers do not extend their initial 3-month forbearance terms. Watching the search data should also give an early indication if a second wave of forbearance requests is about to break.
Google Trends data provides a clear picture of interest in forbearance (Exhibit 1). The exhibit shows the weekly level of search activity for the phrase “forbearance” over the prior two years, with the most active week scaled to 100%. It plots the past year and the year prior alongside each other to give a year-over-year reference.
Exhibit 1: Google trends tell the story around forbearance during COVID-19
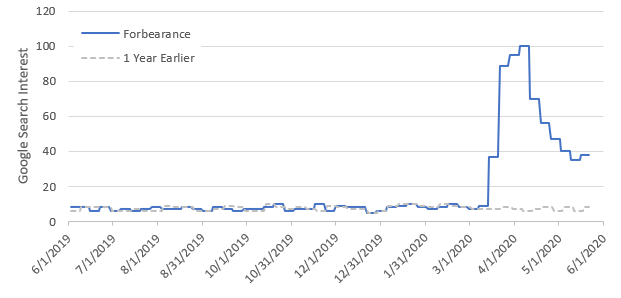
Source: Google, Amherst Pierpont Securities
Search interest in forbearance rose sharply after the middle of March, which coincided with the beginning of COVID lockdowns in many states and the resulting spike in new unemployment claims. Forbearance was a central topic as Congress deliberated and passed the CARES Act. Search activity peaked for the week ending April 8 and declined roughly 60% by the middle of May. However, this level is still about five times higher than the interest one year earlier.
The data tracks nicely against the MBA reports (Exhibit 2). First, since the MBA only reported monthly until April, the analysis assumes that all the growth in forbearance came in the second half of the month. Second, the exhibit compares the MBA’s survey to the search interest reported one week earlier. This lag significantly improves the correlation
The search data shows little to no pickup in interest in the middle of the month when late fees are charged nor at the end of the month when the due date approaches. There had been speculation that those two points in the payment cycle might motivate borrowers to call, but that does not appear to a big factor in the decision to request forbearance. It is possible the pay cycle is driving the small uptick in the most recent week, but the effect, if any, is small.
Exhibit 2: Google searches for “forbearance” appear to correlate with changes in the MBA’s forbearance survey the following week.
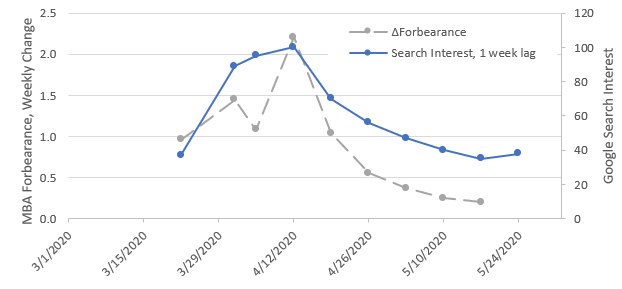
Note: The MBA forbearance data is plotted against the as-of date provided in the report, which is nine days prior to the reporting date. Each value is the change in forbearance between reports (the MBA reports the level of forbearance). The MBA survey was not conducted weekly prior to April, so the exhibit assumes that all of the March forbearance growth came in the second half of the month. The Google search data appears to be a leading indicator of forbearance activity, so was plotted on a one week lag. Source: Google, Mortgage Bankers Association, Amherst Pierpont Securities
The timing difference means that Google’s data provides a view of forbearance activity almost two weeks ahead of the MBA’s survey. Google’s data is constantly updated with a three-day delay but is relevant for the week ahead, so it indicates forbearance activity roughly four days from now. The MBA’s survey shows updates on a nine-day lag. Combining the effects means the Google data has a 13-day advantage.
Simple regression further tightens the fit (Exhibit 3). The analysis used a linear regression to model the change in the MBA’s forbearance levels on the level of search activity one week earlier. The results suggest that Google search interest for “forbearance” can explain roughly 70% of the weekly changes in the MBA’s forbearance survey, 13 days in advance.
Exhibit 3: A simple regression confirms the predictive power of Google search interest in forbearance
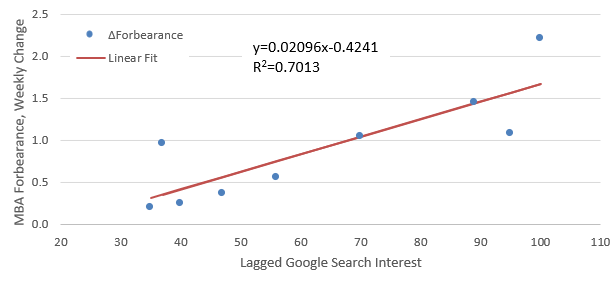
Source: Google, Mortgage Bankers Association, Amherst Pierpont Securities
The search data appears to be bottoming out at just under 40% of the peak activity. Based on the relationship between search interest and change in MBA forbearance, this suggests roughly 0.35% of loans should be placed on forbearance plans each week. It is a small increase considering 8.36% of loans are already on forbearance plans. Most borrowers took an initial three months of forbearance in April and will need to extend or resolve the delinquency in July. Roughly 11% of loans will be on forbearance plans in July if this pace continues—8.36% today plus 0.35% per week for eight weeks. But if the economy improves as lockdowns end, it is possible that the total number of loans in forbearance could decline.
The search activity might also provide a clue as to whether existing borrowers on forbearance are more likely to request extensions. If few borrowers search about forbearance, then it is more likely that existing borrowers might cure. On the other hand, if search activity increases, then fewer borrowers may be in the financial position to resume mortgage payments. The search data’s nearly two-week lead time over the MBA’s survey and greater frequency of updating could provide an edge in determining the ongoing pace of forbearance requests, when, and how high forbearance will peak.