Uncategorized
The impact of Fed QE4 MBS purchases on TBA
admin | May 15, 2020
This material is a Marketing Communication and does not constitute Independent Investment Research.
The Fed has bought an enormous amount of agency MBS as part of its strategy to calm financial markets during the COVID-19 pandemic. The $642 billion in MBS purchased through May 14 marks the fastest pace of any round of QE. The central bank has steadily slowed its purchases through much of April and May, and the majority of its UMBS 30-year buying has settled. Sizable duration and negative convexity has left the market with the Fed concentrating its buying in 30-year 2.5%s and 3.0%s. The Fed has taken out nearly 55% of the float in 2.5%s, improving the chances of a special dollar roll. And in 30-year 3.0%s, the Fed has taken delivery of pools with worse convexity than the remaining float, improving the quality of TBA.
The composition of MBS bought so far in QE4
The Fed bought 30-year UMBS coupons from 2.5%s to 4.0%s but was most heavily concentrated in 2.5%s and 3.0%s (Exhibit 1). This reflects a desire to prevent the coupon stack from becoming too distorted, but an emphasis on lower coupons also helps support originators and hopefully lowers mortgage rates available to borrowers. These coupons have the longest durations on the stack, other than the limited supply of 2.0%s, and are the most negatively convex. The Fed has consequently improved the quality of the overall MBS float.
Exhibit 1: UMBS QE4 purchases were concentrated in 2.5%s and 3.0%s
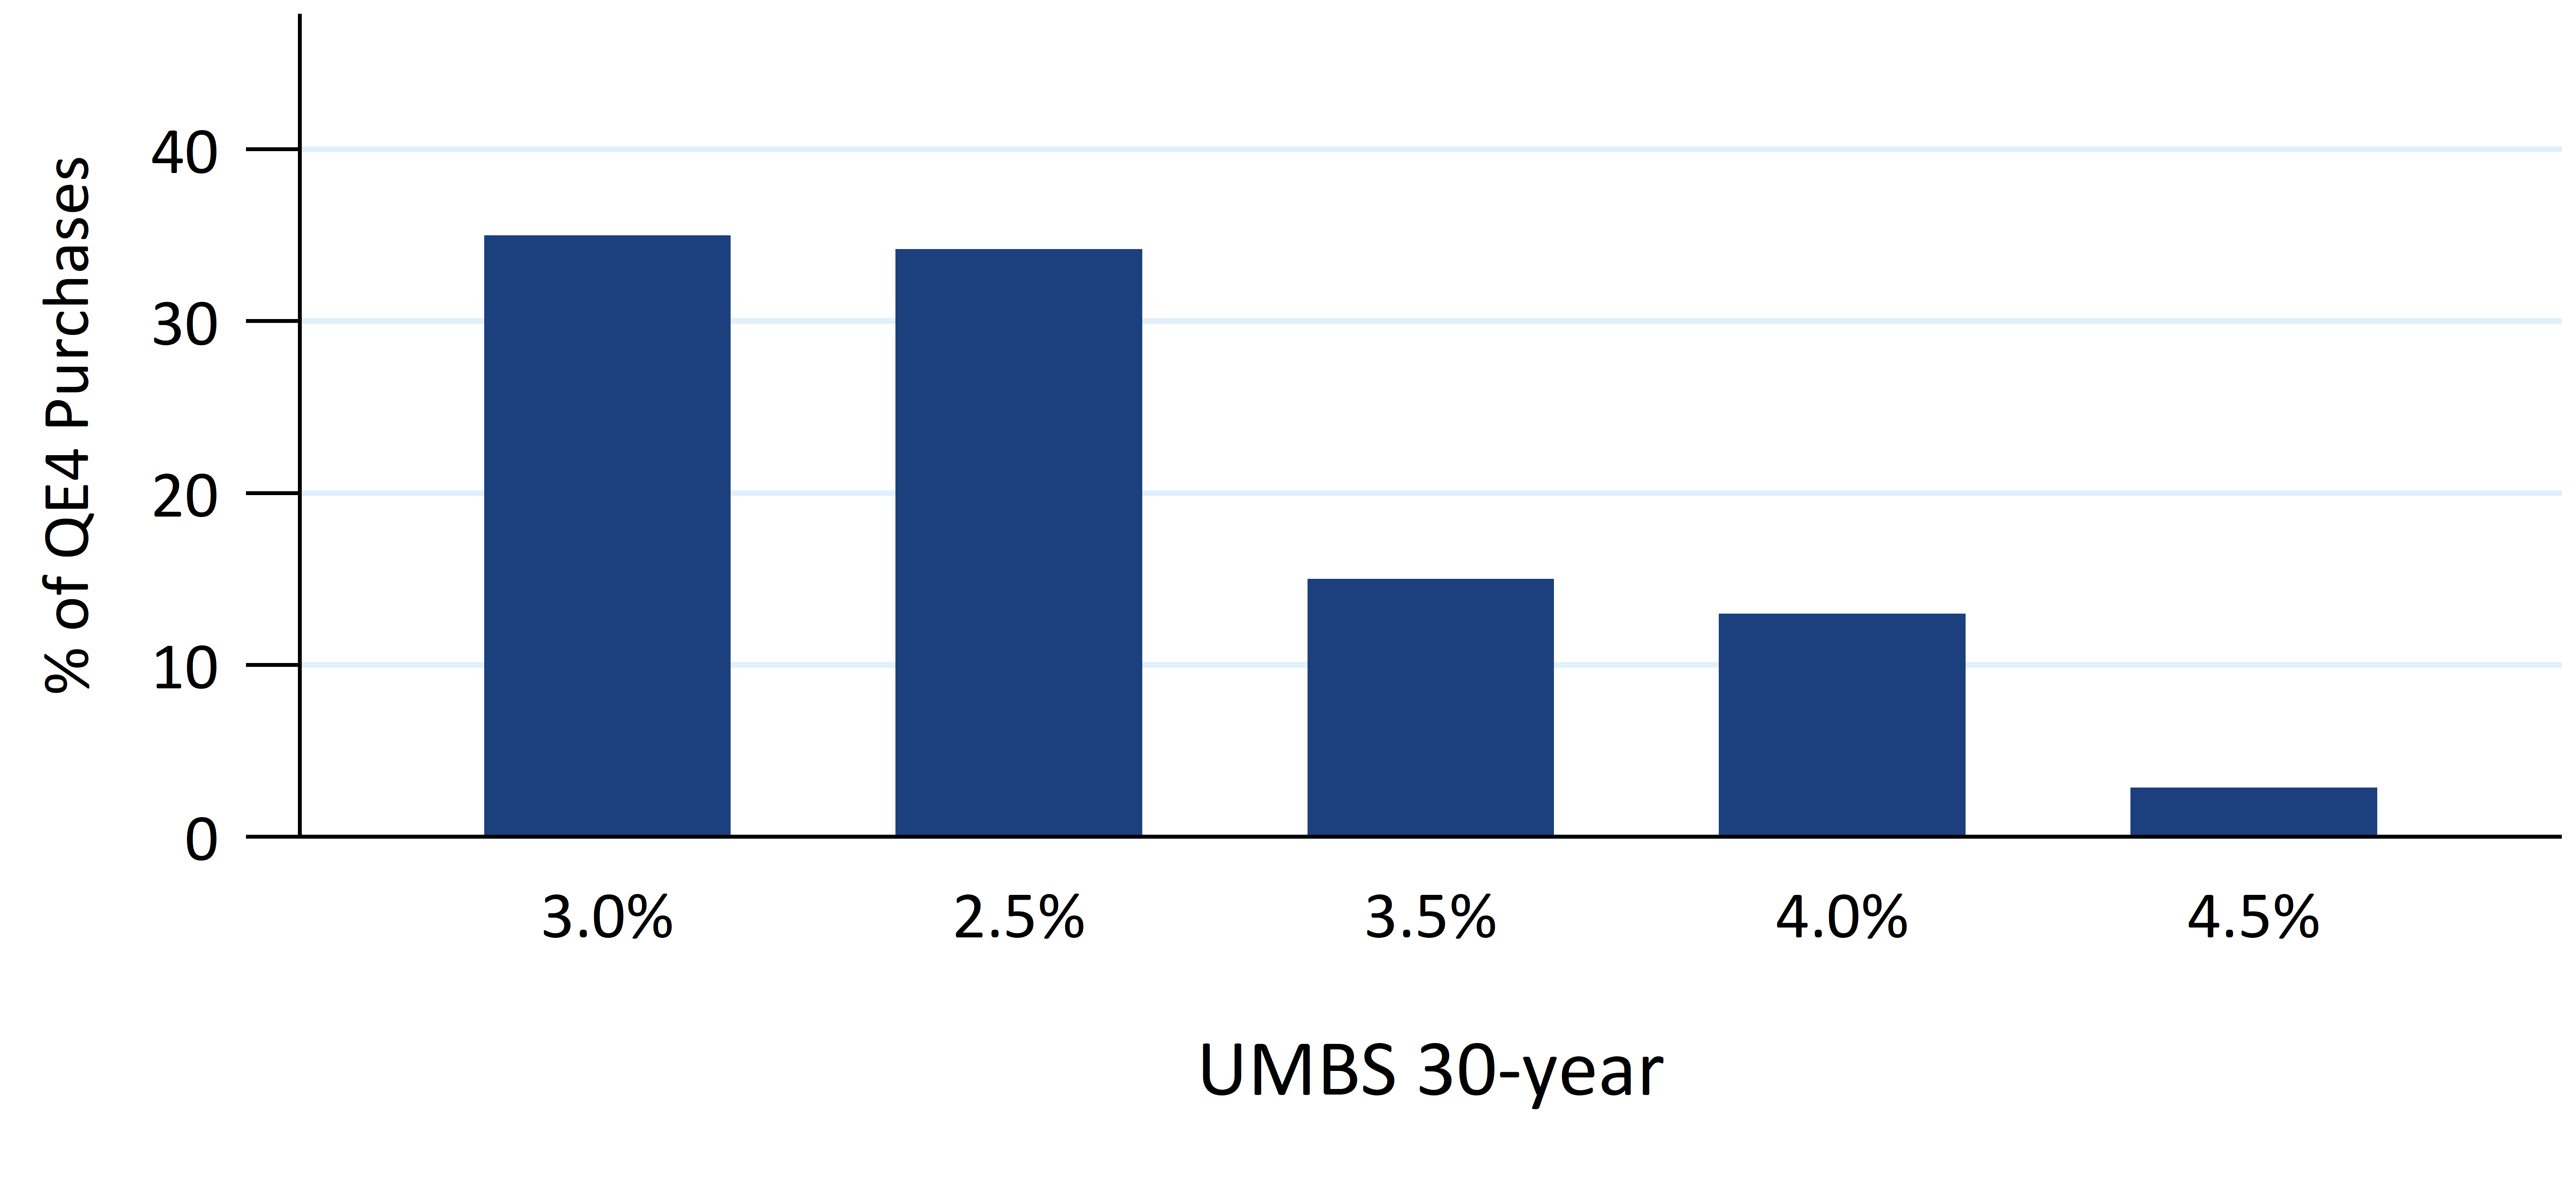
Note: Sorted from highest to lowest. Source: Federal Reserve, Fannie Mae, Freddie Mac, Ginnie Mae, eMBS, Amherst Pierpont Securities
Likely to help the dollar roll in 30-year 2.5%s
The most dramatic effect is on the float of UMBS 2.5%s (Exhibit 2). The Fed bought almost as many 2.5%s and 3.0%s, but the float of 2.5%s was much smaller. The Fed has bought almost 55% of the float in that coupon. And most of that coupon is still available since there has been little production of spec pools or usage of that coupon in CMOs. This also raises the likelihood that the 2.5% roll will trade special.
Exhibit 2: The Fed removed 55% of the float in UMBS 2.5%s
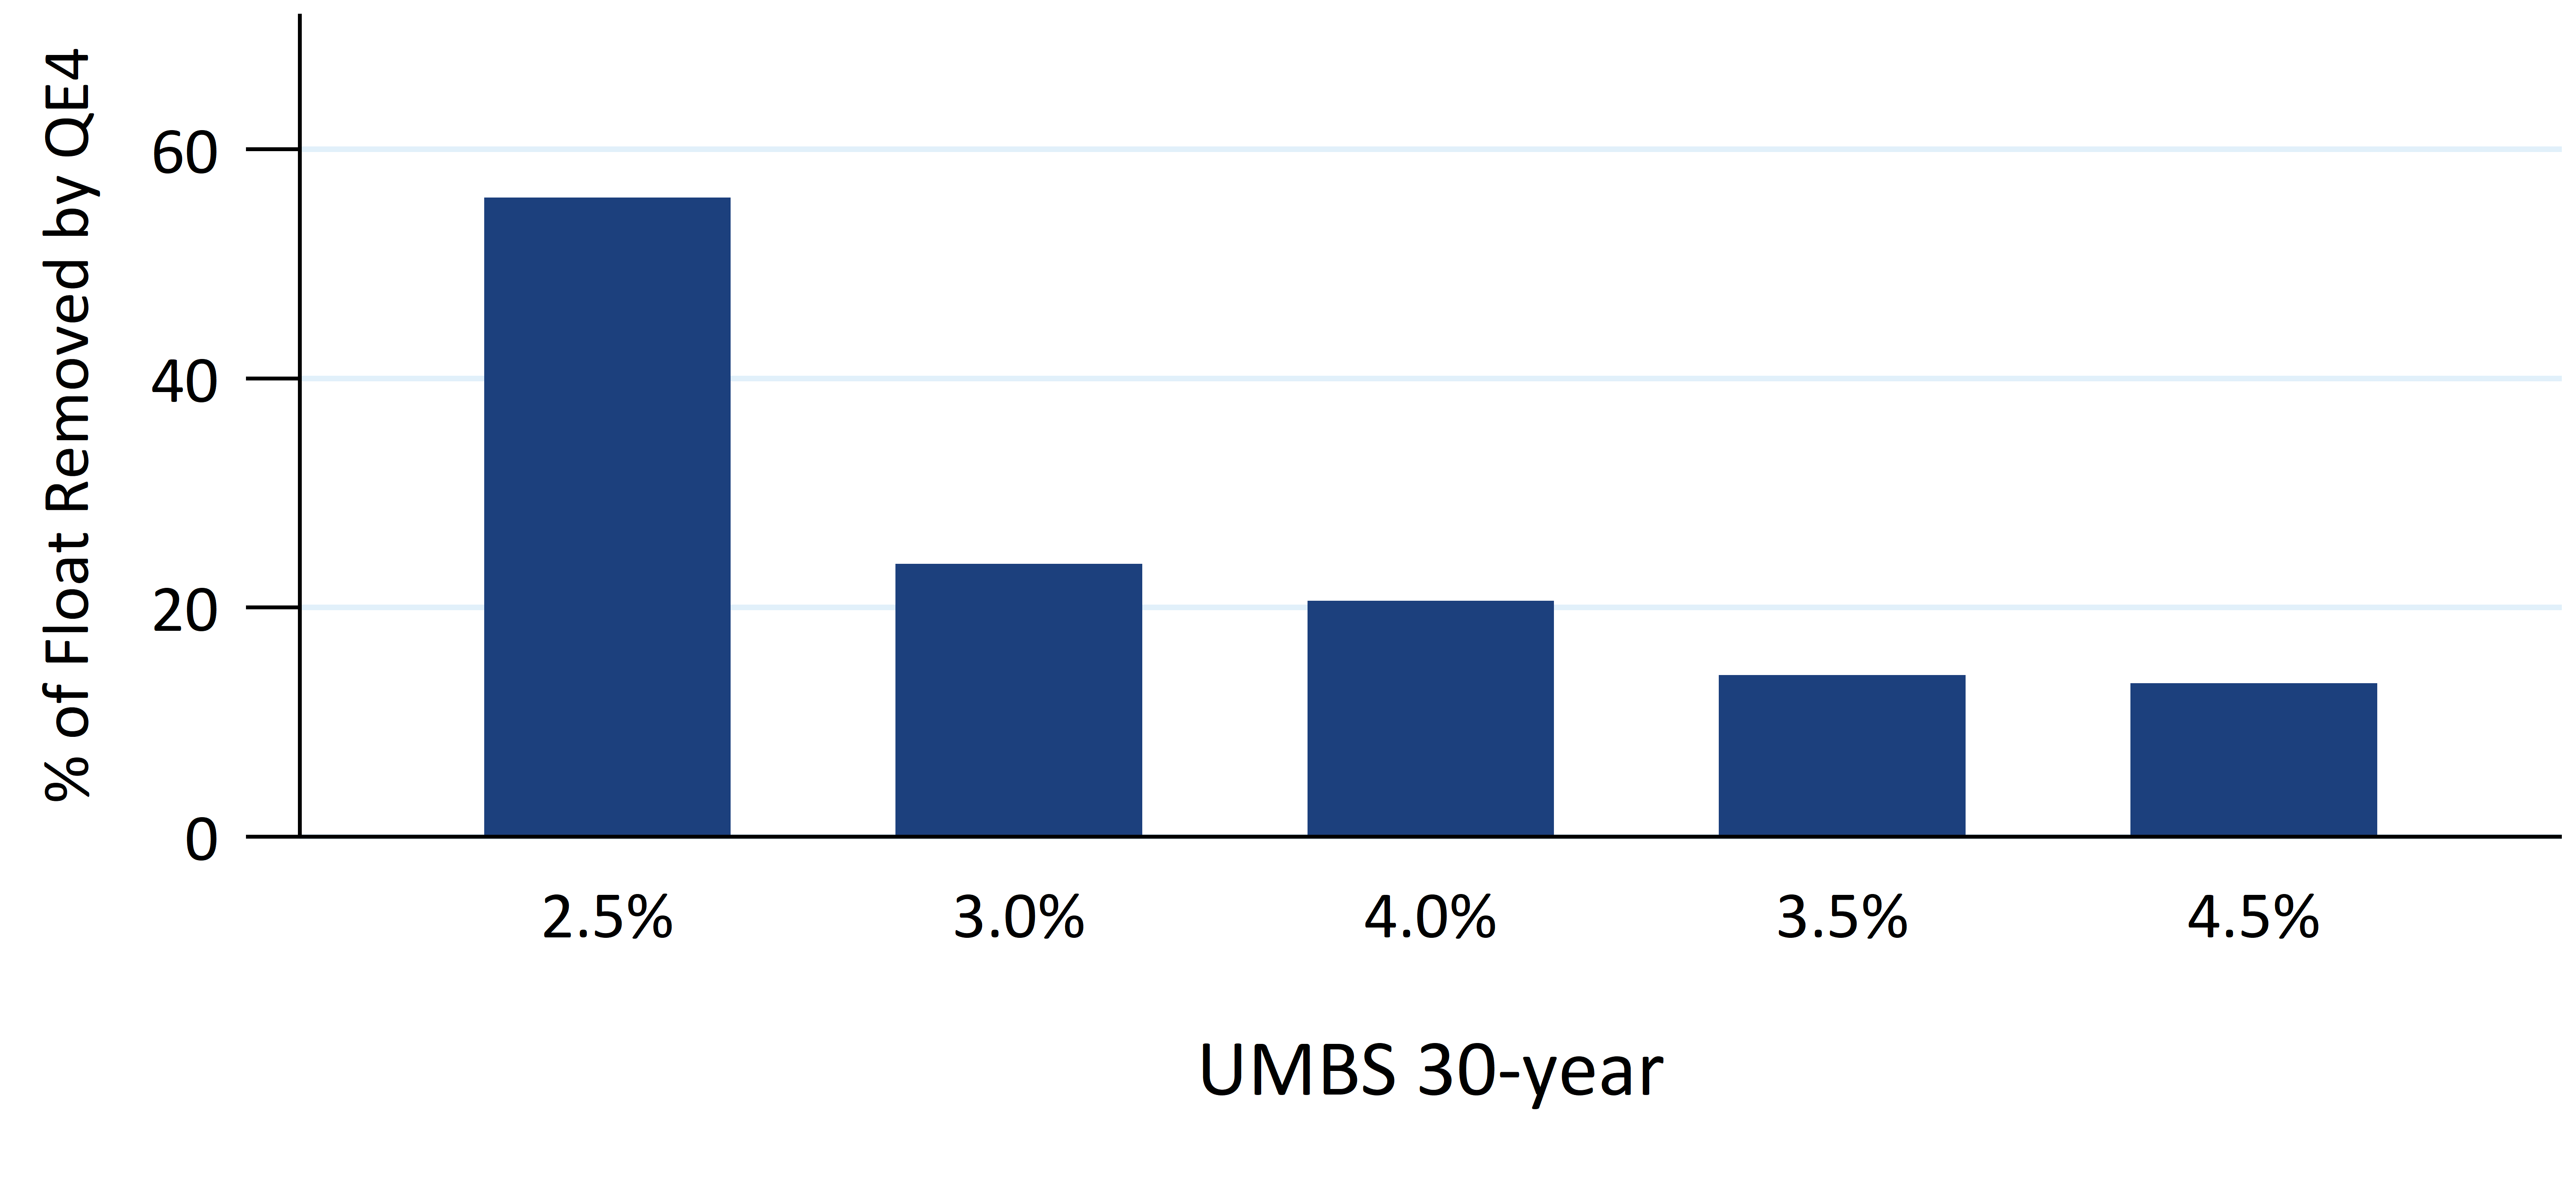
Note: The % of that coupon’s float removed by the Fed’s QE4 purchasing. The float is measured before QE4 and removes any pools owned by the Fed, in CMOs, or in spec pools at the start of QE4. Sorted from highest to lowest. Source: Federal Reserve, Fannie Mae, Freddie Mac, Ginnie Mae, eMBS, Amherst Pierpont Securities
The Fed’s buying has removed some of the worse 3.0% UMBS pools. The Fed’s purchases have averaged five months of seasoning, right on the cusp of when significant restrictions against refinancing are lifted. Loans can prepay extremely quickly in the 6 to 12 WALA band. Fed loans, at an average size of $344,000, are also larger than the average of the float. The float averages $307,000, and is roughly $320,000 for the 2019 and 2020 vintages. A similar pattern, although not as pronounced, can be seen in their 3.5% purchases—the pools tend to have higher average loan sizes and are at a seasoning that tends to pose a lot of prepayment risk. The trailing 1-month and 3-month CPRs for their purchases highlight that these pools prepaid much faster than the pools left in the float.
Exhibit 3: UMBS 30-year
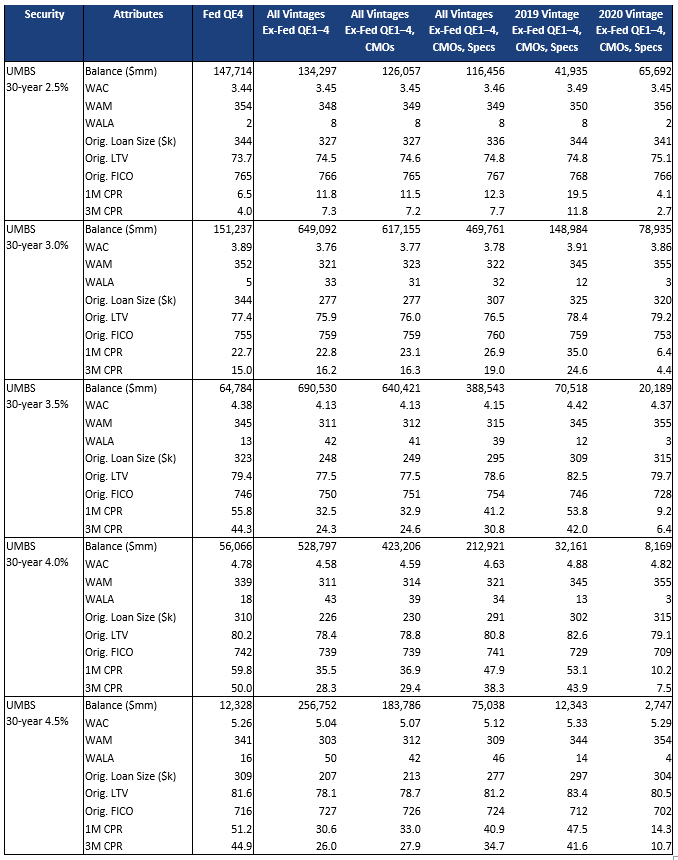
Note: Spec pools include pools with a maximum loan size up to $200,000, low FICO pools, high LTV, 100% investor, 100% New York, 100% Puerto Rico, and 100% Texas. Ginnie Mae spec pools also include 100% Rural Housing and 100% Public Indian Housing pools. Source: Federal Reserve, Fannie Mae, Freddie Mac, Ginnie Mae, eMBS, Amherst Pierpont Securities
Exhibit 4: Ginnie Mae 30-year
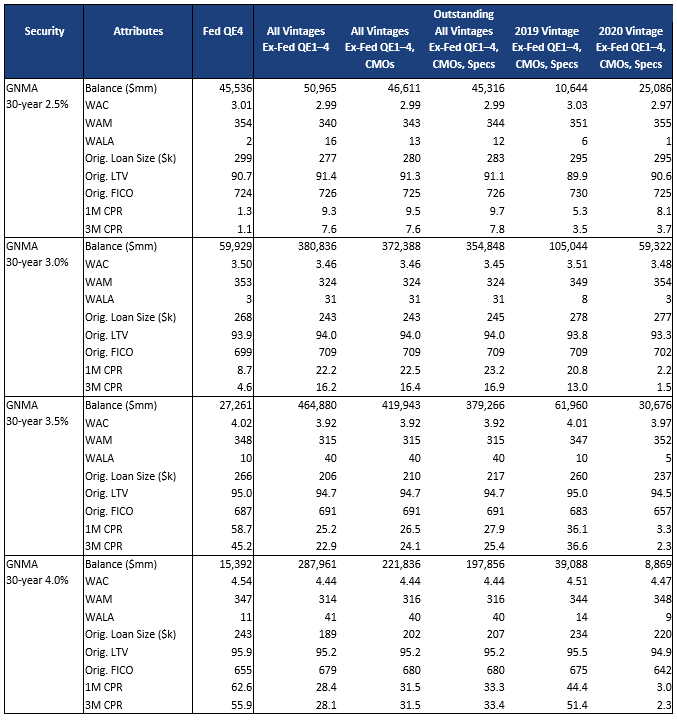
Note: Spec pools include pools with a maximum loan size up to $200,000, low FICO pools, high LTV, 100% investor, 100% New York, 100% Puerto Rico, and 100% Texas. Ginnie Mae spec pools also include 100% Rural Housing and 100% Public Indian Housing pools. Source: Federal Reserve, Fannie Mae, Freddie Mac, Ginnie Mae, eMBS, Amherst Pierpont Securities
Exhibit 5: UMBS 15-year
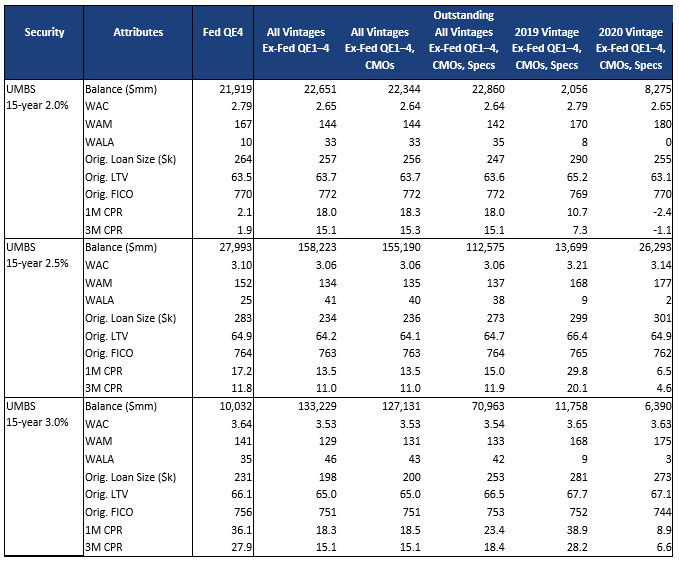
Note: Spec pools include pools with a maximum loan size up to $200,000, low FICO pools, high LTV, 100% investor, 100% New York, 100% Puerto Rico, and 100% Texas. Ginnie Mae spec pools also include 100% Rural Housing and 100% Public Indian Housing pools. Source: Federal Reserve, Fannie Mae, Freddie Mac, Ginnie Mae, eMBS, Amherst Pierpont Securities
This material is intended only for institutional investors and does not carry all of the independence and disclosure standards of retail debt research reports. In the preparation of this material, the author may have consulted or otherwise discussed the matters referenced herein with one or more of SCM’s trading desks, any of which may have accumulated or otherwise taken a position, long or short, in any of the financial instruments discussed in or related to this material. Further, SCM may act as a market maker or principal dealer and may have proprietary interests that differ or conflict with the recipient hereof, in connection with any financial instrument discussed in or related to this material.
This message, including any attachments or links contained herein, is subject to important disclaimers, conditions, and disclosures regarding Electronic Communications, which you can find at https://portfolio-strategy.apsec.com/sancap-disclaimers-and-disclosures.
Important Disclaimers
Copyright © 2026 Santander US Capital Markets LLC and its affiliates (“SCM”). All rights reserved. SCM is a member of FINRA and SIPC. This material is intended for limited distribution to institutions only and is not publicly available. Any unauthorized use or disclosure is prohibited.
In making this material available, SCM (i) is not providing any advice to the recipient, including, without limitation, any advice as to investment, legal, accounting, tax and financial matters, (ii) is not acting as an advisor or fiduciary in respect of the recipient, (iii) is not making any predictions or projections and (iv) intends that any recipient to which SCM has provided this material is an “institutional investor” (as defined under applicable law and regulation, including FINRA Rule 4512 and that this material will not be disseminated, in whole or part, to any third party by the recipient.
The author of this material is an economist, desk strategist or trader. In the preparation of this material, the author may have consulted or otherwise discussed the matters referenced herein with one or more of SCM’s trading desks, any of which may have accumulated or otherwise taken a position, long or short, in any of the financial instruments discussed in or related to this material. Further, SCM or any of its affiliates may act as a market maker or principal dealer and may have proprietary interests that differ or conflict with the recipient hereof, in connection with any financial instrument discussed in or related to this material.
This material (i) has been prepared for information purposes only and does not constitute a solicitation or an offer to buy or sell any securities, related investments or other financial instruments, (ii) is neither research, a “research report” as commonly understood under the securities laws and regulations promulgated thereunder nor the product of a research department, (iii) or parts thereof may have been obtained from various sources, the reliability of which has not been verified and cannot be guaranteed by SCM, (iv) should not be reproduced or disclosed to any other person, without SCM’s prior consent and (v) is not intended for distribution in any jurisdiction in which its distribution would be prohibited.
In connection with this material, SCM (i) makes no representation or warranties as to the appropriateness or reliance for use in any transaction or as to the permissibility or legality of any financial instrument in any jurisdiction, (ii) believes the information in this material to be reliable, has not independently verified such information and makes no representation, express or implied, with regard to the accuracy or completeness of such information, (iii) accepts no responsibility or liability as to any reliance placed, or investment decision made, on the basis of such information by the recipient and (iv) does not undertake, and disclaims any duty to undertake, to update or to revise the information contained in this material.
Unless otherwise stated, the views, opinions, forecasts, valuations, or estimates contained in this material are those solely of the author, as of the date of publication of this material, and are subject to change without notice. The recipient of this material should make an independent evaluation of this information and make such other investigations as the recipient considers necessary (including obtaining independent financial advice), before transacting in any financial market or instrument discussed in or related to this material.
Important disclaimers for clients in the EU and UK
This publication has been prepared by Trading Desk Strategists within the Sales and Trading functions of Santander US Capital Markets LLC (“SanCap”), the US registered broker-dealer of Santander Corporate & Investment Banking. This communication is distributed in the EEA by Banco Santander S.A., a credit institution registered in Spain and authorised and regulated by the Bank of Spain and the CNMV. Any EEA recipient of this communication that would like to affect any transaction in any security or issuer discussed herein should do so with Banco Santander S.A. or any of its affiliates (together “Santander”). This communication has been distributed in the UK by Banco Santander, S.A.’s London branch, authorised by the Bank of Spain and subject to regulatory oversight on certain matters by the Financial Conduct Authority (FCA) and the Prudential Regulation Authority (PRA).
The publication is intended for exclusive use for Professional Clients and Eligible Counterparties as defined by MiFID II and is not intended for use by retail customers or for any persons or entities in any jurisdictions or country where such distribution or use would be contrary to local law or regulation.
This material is not a product of Santander´s Research Team and does not constitute independent investment research. This is a marketing communication and may contain ¨investment recommendations¨ as defined by the Market Abuse Regulation 596/2014 ("MAR"). This publication has not been prepared in accordance with legal requirements designed to promote the independence of research and is not subject to any prohibition on dealing ahead of the dissemination of investment research. The author, date and time of the production of this publication are as indicated herein.
This publication does not constitute investment advice and may not be relied upon to form an investment decision, nor should it be construed as any offer to sell or issue or invitation to purchase, acquire or subscribe for any instruments referred herein. The publication has been prepared in good faith and based on information Santander considers reliable as of the date of publication, but Santander does not guarantee or represent, express or implied, that such information is accurate or complete. All estimates, forecasts and opinions are current as at the date of this publication and are subject to change without notice. Unless otherwise indicated, Santander does not intend to update this publication. The views and commentary in this publication may not be objective or independent of the interests of the Trading and Sales functions of Santander, who may be active participants in the markets, investments or strategies referred to herein and/or may receive compensation from investment banking and non-investment banking services from entities mentioned herein. Santander may trade as principal, make a market or hold positions in instruments (or related derivatives) and/or hold financial interest in entities discussed herein. Santander may provide market commentary or trading strategies to other clients or engage in transactions which may differ from views expressed herein. Santander may have acted upon the contents of this publication prior to you having received it.
This publication is intended for the exclusive use of the recipient and must not be reproduced, redistributed or transmitted, in whole or in part, without Santander’s consent. The recipient agrees to keep confidential at all times information contained herein.


