Uncategorized
Broadridge Financial Solutions: Your proxy awaits
admin | May 15, 2020
This material is a Marketing Communication and does not constitute Independent Investment Research.
The leading third-party provider of investor regulatory-required communications and proxy voting services, BR (Baa1/BBB+/BBB+), has proven that even a pandemic will not hinder its organic growth or impede stable cash flow generation. With net leverage comparable to Moody’s (MCO – BBB+/BBB+) and guidance left relatively unchanged for their fiscal 2020 ending June 30th, there is value in BR 2.9% 2029 paper relative to MCO 4.25% 2029 bonds. A swap provides for roughly a 25 bp pick-up in g-spread while taking out nearly 12 points.
BR has built up a sizeable client base as 900+ banks and brokers rely on its proxy management business, which has become the industry standard given its strong execution track record. Additionally, BR processes $7 trillion worth of fixed income and equity trades per day. As ubiquitous as MCO and S&P (SPGI – A3/A-) are to credit ratings, BR garners the same recognition when it comes to proxies. BR’s business profile can be classified as strong, as it is underscored by a sizeable recurring revenue base. With comparable net leverage to MCO and guidance left relatively unchanged for fiscal 2020 (ending June 30th), there is value in BR 2.9% 2029 paper relative to MCO 4.25% 2029 bonds. A swap provides for roughly a 25 bp pick-up in g-spread while taking out nearly 12 points.
Exhibit 1: BR vs. MCO Spread Curve
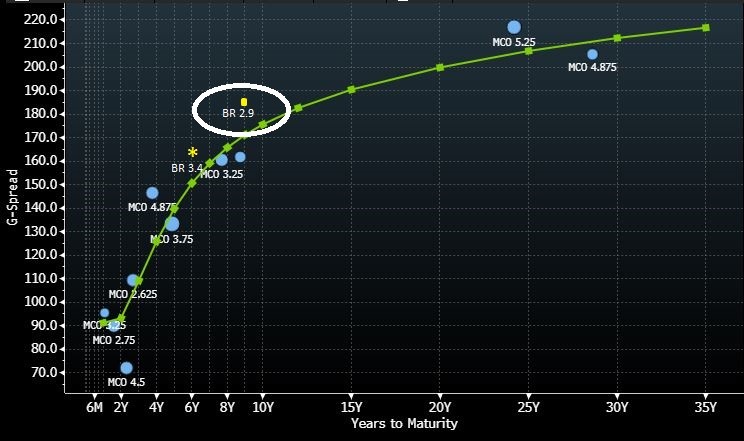
Source: Bloomberg TRACE, Amherst Pierpont Securities
COVID-19 Who?
BR’s most recent quarterly results highlighted the minimal impact that COVID-19 is having on top line growth and cash flow generation. BR’s stable results are largely driven by its resilient recurring fee revenue base, which accounts for roughly 70% of total revenues and growing. For fiscal 3Q20, recurring fee revenues grew 9%, and 3% on an organic basis. From a business perspective, the growth was largely fueled by higher trading volumes associated with COVID-19 market volatility. Management expects organic recurring fee revenue growth to be even higher in 4Q20 as volatility in 3Q shifted some proxy work into the subsequent quarter. We note that during the 2008/2009 financial crisis, BR posted positive organic recurring fee revenue growth each fiscal year (FY08-FY11). This demonstrates the resilience of its top line in turbulent economic times.
Exhibit 2: BR Total Recurring Fee Revenue Growth During Financial Crisis
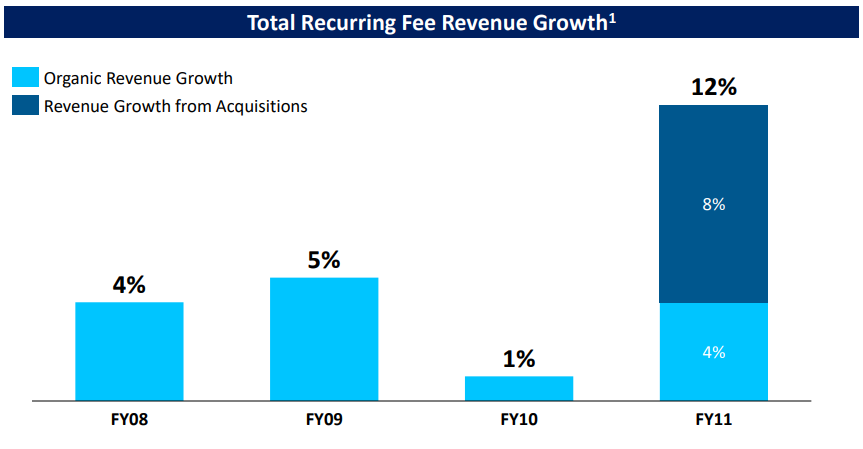
Note: (1) Total recurring fee revenue growth %, as reported. Source: BR Investor Presentation, Amherst Pierpont Securities
Adjusted operating income margin of 21% in fiscal 3Q, expanded 10 bp year-over-year, reflecting increased recurring fee revenues more than offsetting lower event-driven revenues. Free cash flow is somewhat seasonal with the majority of annual free cash flow generated in 4Q. For the first nine months of the fiscal year, BR generated $82 million of free cash flow, which reflected lower net earnings from the year-ago period coupled with higher capital expenditures. Increased capital spending for the year was expected as the company has been making a large investment in an industry management platform.
Leverage Expected to Improve
BR ended 3Q with debt/EBITDA of 2.4x and net leverage of 1.9x. This is on par with MCO whose net leverage is currently 1.9x as well. Management explicitly stated its commitment to its strong Investment Grade rating, which remains an important factor in its capital planning. As such, BR takes a balanced and disciplined approach to both M&A and shareholder remuneration. That said, given the current environment, management remains committed to its 2.0x leverage target by FYE20. BR will be using free cash flow generated in the quarter to reduce debt to hit its target. BR has $400 million of debt maturing on 9/1/20, which they could look to redeem early, or repay borrowings under its revolver which stood at $442.5 million as of 3/31/20. BR maintains very strong liquidity with $400 million of cash on hand and $1.1 billion of availability under its revolver.
Exhibit 3: BR FY20 Guidance
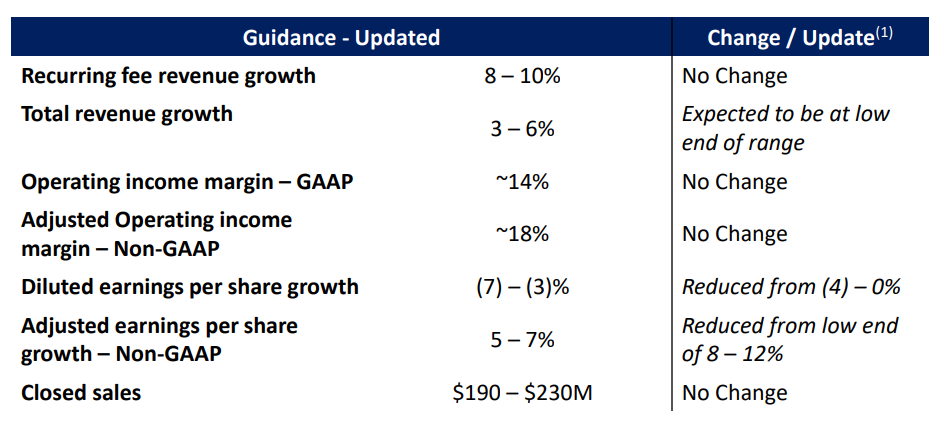
(1) From full-year guidance provided in earnings release 2Q20 on 1/31/20 Source: BR Investor Presentation; APS
Full Year Guidance Largely Reaffirmed
As more companies pull full year guidance due to lack of visibility, BR has not only provided full year guidance but has kept it largely unchanged with only a few updates. Management feels comfortable with providing guidance due to its recurring fee revenue base coupled with its revenue backlog. Recurring revenue backlog stood at $330 million, which was up from $295 million in the year ago period. The current backlog is equivalent to 11% of the company’s $3 billion in recurring revenue. This provides them with a strong starting point to generate revenue growth in the absence of any new sales. Additionally, BR has been able to achieve as 97+% client revenue retention rate. Importantly, management left its recurring fee revenue growth guidance unchanged as well as its operating margin guidance. Total revenue guidance is now expected to be at the low end of its previous 3%-6% range. MCO expects revenues for the full year to be down in the mid-single digit range.
This material is intended only for institutional investors and does not carry all of the independence and disclosure standards of retail debt research reports. In the preparation of this material, the author may have consulted or otherwise discussed the matters referenced herein with one or more of SCM’s trading desks, any of which may have accumulated or otherwise taken a position, long or short, in any of the financial instruments discussed in or related to this material. Further, SCM may act as a market maker or principal dealer and may have proprietary interests that differ or conflict with the recipient hereof, in connection with any financial instrument discussed in or related to this material.
This message, including any attachments or links contained herein, is subject to important disclaimers, conditions, and disclosures regarding Electronic Communications, which you can find at https://portfolio-strategy.apsec.com/sancap-disclaimers-and-disclosures.
Important Disclaimers
Copyright © 2026 Santander US Capital Markets LLC and its affiliates (“SCM”). All rights reserved. SCM is a member of FINRA and SIPC. This material is intended for limited distribution to institutions only and is not publicly available. Any unauthorized use or disclosure is prohibited.
In making this material available, SCM (i) is not providing any advice to the recipient, including, without limitation, any advice as to investment, legal, accounting, tax and financial matters, (ii) is not acting as an advisor or fiduciary in respect of the recipient, (iii) is not making any predictions or projections and (iv) intends that any recipient to which SCM has provided this material is an “institutional investor” (as defined under applicable law and regulation, including FINRA Rule 4512 and that this material will not be disseminated, in whole or part, to any third party by the recipient.
The author of this material is an economist, desk strategist or trader. In the preparation of this material, the author may have consulted or otherwise discussed the matters referenced herein with one or more of SCM’s trading desks, any of which may have accumulated or otherwise taken a position, long or short, in any of the financial instruments discussed in or related to this material. Further, SCM or any of its affiliates may act as a market maker or principal dealer and may have proprietary interests that differ or conflict with the recipient hereof, in connection with any financial instrument discussed in or related to this material.
This material (i) has been prepared for information purposes only and does not constitute a solicitation or an offer to buy or sell any securities, related investments or other financial instruments, (ii) is neither research, a “research report” as commonly understood under the securities laws and regulations promulgated thereunder nor the product of a research department, (iii) or parts thereof may have been obtained from various sources, the reliability of which has not been verified and cannot be guaranteed by SCM, (iv) should not be reproduced or disclosed to any other person, without SCM’s prior consent and (v) is not intended for distribution in any jurisdiction in which its distribution would be prohibited.
In connection with this material, SCM (i) makes no representation or warranties as to the appropriateness or reliance for use in any transaction or as to the permissibility or legality of any financial instrument in any jurisdiction, (ii) believes the information in this material to be reliable, has not independently verified such information and makes no representation, express or implied, with regard to the accuracy or completeness of such information, (iii) accepts no responsibility or liability as to any reliance placed, or investment decision made, on the basis of such information by the recipient and (iv) does not undertake, and disclaims any duty to undertake, to update or to revise the information contained in this material.
Unless otherwise stated, the views, opinions, forecasts, valuations, or estimates contained in this material are those solely of the author, as of the date of publication of this material, and are subject to change without notice. The recipient of this material should make an independent evaluation of this information and make such other investigations as the recipient considers necessary (including obtaining independent financial advice), before transacting in any financial market or instrument discussed in or related to this material.
Important disclaimers for clients in the EU and UK
This publication has been prepared by Trading Desk Strategists within the Sales and Trading functions of Santander US Capital Markets LLC (“SanCap”), the US registered broker-dealer of Santander Corporate & Investment Banking. This communication is distributed in the EEA by Banco Santander S.A., a credit institution registered in Spain and authorised and regulated by the Bank of Spain and the CNMV. Any EEA recipient of this communication that would like to affect any transaction in any security or issuer discussed herein should do so with Banco Santander S.A. or any of its affiliates (together “Santander”). This communication has been distributed in the UK by Banco Santander, S.A.’s London branch, authorised by the Bank of Spain and subject to regulatory oversight on certain matters by the Financial Conduct Authority (FCA) and the Prudential Regulation Authority (PRA).
The publication is intended for exclusive use for Professional Clients and Eligible Counterparties as defined by MiFID II and is not intended for use by retail customers or for any persons or entities in any jurisdictions or country where such distribution or use would be contrary to local law or regulation.
This material is not a product of Santander´s Research Team and does not constitute independent investment research. This is a marketing communication and may contain ¨investment recommendations¨ as defined by the Market Abuse Regulation 596/2014 ("MAR"). This publication has not been prepared in accordance with legal requirements designed to promote the independence of research and is not subject to any prohibition on dealing ahead of the dissemination of investment research. The author, date and time of the production of this publication are as indicated herein.
This publication does not constitute investment advice and may not be relied upon to form an investment decision, nor should it be construed as any offer to sell or issue or invitation to purchase, acquire or subscribe for any instruments referred herein. The publication has been prepared in good faith and based on information Santander considers reliable as of the date of publication, but Santander does not guarantee or represent, express or implied, that such information is accurate or complete. All estimates, forecasts and opinions are current as at the date of this publication and are subject to change without notice. Unless otherwise indicated, Santander does not intend to update this publication. The views and commentary in this publication may not be objective or independent of the interests of the Trading and Sales functions of Santander, who may be active participants in the markets, investments or strategies referred to herein and/or may receive compensation from investment banking and non-investment banking services from entities mentioned herein. Santander may trade as principal, make a market or hold positions in instruments (or related derivatives) and/or hold financial interest in entities discussed herein. Santander may provide market commentary or trading strategies to other clients or engage in transactions which may differ from views expressed herein. Santander may have acted upon the contents of this publication prior to you having received it.
This publication is intended for the exclusive use of the recipient and must not be reproduced, redistributed or transmitted, in whole or in part, without Santander’s consent. The recipient agrees to keep confidential at all times information contained herein.


