


Uncategorized
A PPPowerful wave of bank reinvestment
admin | May 15, 2020
This material is a Marketing Communication and does not constitute Independent Investment Research.
Bank balance sheets have started doing extraordinary things in these extraordinary times, including growing their book of commercial and industrial loans at a rate six times faster than the fastest pace seen in the last half century. Bank C&I loan books since February have jumped by $660 billion, most backed by the Small Business Administration’s Paycheck Protection Program. Most PPP loans should repay after roughly eight weeks, releasing a wave of cash in coming months needing reinvestment. Liquid, safe assets top the list of likely reinvestment candidates, but the path there may involve some twists and turns.
A surge in bank funding, lending and investment
To understand where banks may go with their cash, it helps to see where they have gone in March and April. From February 26 to April 29, bank assets and liabilities expanded by nearly $2.5 trillion (Exhibit 1).
Exhibit 1: A nearly $2.5 trillion jump in bank balance sheets in March, April
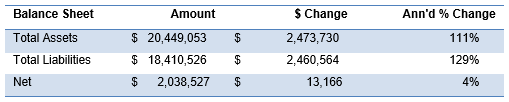
Note: Tables show amount on 3/29/2020, changes since 2/26/2020, and a CAGR. Source: Federal Reserve H.8, Amherst Pierpont Securities.
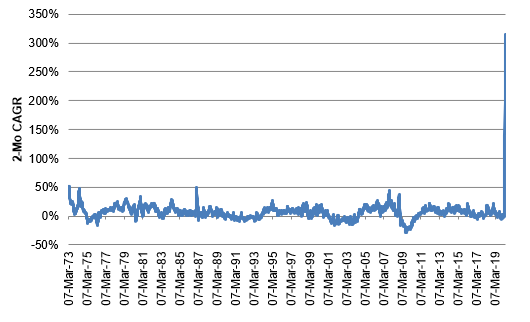
The expansion represented the fastest 2-month pace in at least the last half century (Exhibit 2). Bank balance sheets expanded rapidly after the 2001 recession, helped by strong growth in securities. Balance sheets expanded even faster after the 2008 recession, led by growth in excess reserves. This latest expansion has dwarfed them both.
Exhibit 2: The pace of expansion has dwarfed the 2001 and 2008 recessions
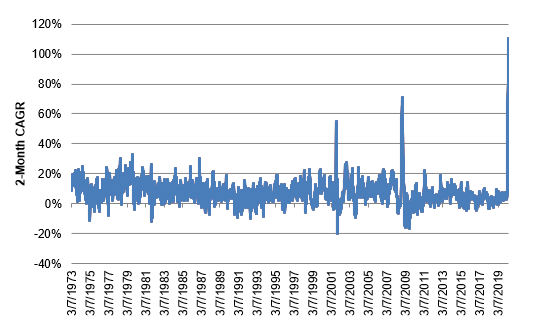
Note: Data shows CAGR of total assets. Source: Federal Reserve H.8, Amherst Pierpont Securities
A powerful effect of Fed QE
Fed QE has fueled the growth. It is no coincidence that the Fed’s balance sheet from February 26 to April 29 also grew by around $2.5 trillion. The Fed took securities out of the financial system and put cash in. Most of the surge in bank liabilities came in the form of deposits, up $1.7 trillion (Exhibit 3). Borrowings and other liabilities rose. But it is also notable that foreign banks loaned nearly $468 billion to their US offices. The foreign banks may have acquired the funds through the Fed’s dollar swap lines with foreign central banks.
Exhibit 3: More than $1.7 trillion in deposits led the surge in bank liabilities
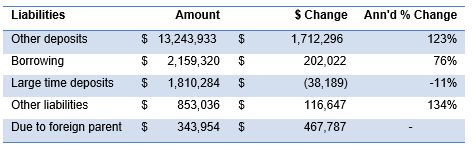
Note: Tables show amount on 3/29/2020, changes since 2/26/2020, and a CAGR. Source: Federal Reserve H.8, Amherst Pierpont Securities.
An important impact from bank regulatory adjustments
Beyond QE, the Fed has also taken extraordinary regulatory steps to allow banks to take on certain assets and liabilities more easily (Exhibit 4). Among the more important, on April 1 the Fed temporarily excluded US Treasury debt and excess reserves from bank holding company calculations of the supplemental leverage ratio, effectively allowing large banks subject to SLR to leverage these assets without limit. On April 9, the Fed removed PPP loans pledged to the Fed PPP Liquidity Facility from calculations of regulatory capital for all banks, allowing banks to leveraged pledged PPP loans without limit. And on May 5, the Fed allowed banks to remove funds provided to finance PPP loans from calculations of liquidity requirements, further reducing the cost of those funds. US Treasury debt, excess reserves and PPP loans have taken on special status in this crisis. In Fed Chair Powell’s speech on May 14, he noted the importance of these regulatory adjustments.
Exhibit 4: Fed regulatory actions related to coronavirus since March 1
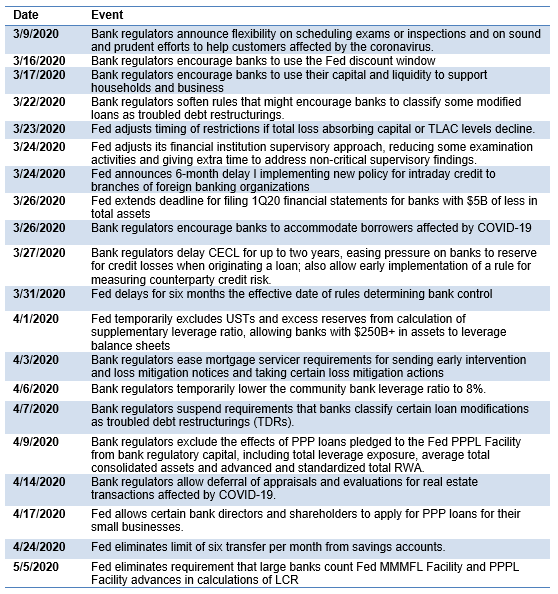
Source: Federal Reserve, Amherst Pierpont Securities
Excess reserves, PPP loans and loss reserves have outstripped other assets
It should come as no surprise that the vast majority of new deposits and other liabilities have flowed into cash assets, led by $1.6 trillion in fed funds and excess reserves (Exhibit 5). The extraordinary growth in C&I loans, an asset that usually takes substantial time to grow, reflects PPP loans. Besides favorable capital and funding, a short maturity, and a federal guarantee of all principal and interest, PPP loans also happen to be profitable. Banks get fees of 5% of the principal balance on loans up to $350,000, 3% on loans between $350,000 and $2 million, and 1% on loans above $1 million. They also get an annualized 1% coupon and pay 0.35% financing at the PPPL Facility. Anecdotally, banks are going to their staff and asking for all hands on deck to make PPP loans.
It is notable that investment in securities has lagged the 111% compounded annual growth in total assets and that growth in loan loss reserves has outstripped average asset growth as banks begin to ready for losses as economic growth and earnings evaporate.
Exhibit 5: Cash assets and C&I loans have led recent bank asset growth
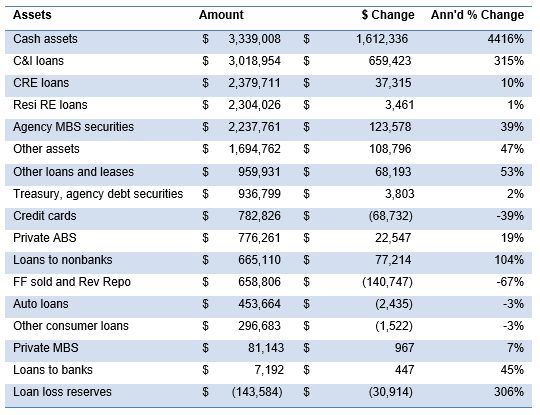
Note: Tables show amount on 3/29/2020 and changes since 2/26/2020. Source: Federal Reserve H.8, Amherst Pierpont Securities.
PPP lending has powered C&I growth at a rate at more than six times the fastest prior pace in the last fifty years (Exhibit 6). C&I portfolio balances usually fall in recessions, with 2001 and 2008 providing good examples. Not this time. The Fed has succeeded in using PPP to get funding through banks to Main Street.
Exhibit 6: C&I growth lately has run more than 6x the pace of past surges
Note: Data shows CAGR of C&I loans. Source: Federal Reserve H.8, Amherst Pierpont Securities
The likely directions for looming reinvestment
A handful of factors will likely shape bank reinvestment in coming months.
The volume of cash building up on bank balance sheets as PPP loans start to repay should be historic, close to the recent $660 billion growth in C&I, and few markets can plausibly absorb that flow. Excess reserves would be the easiest place to go, as growth in reserves since February demonstrates. Treasury debt could accommodate the flow, but may not have the same status as reserves in bank stress tests; Treasury debt barely grew in March and April. Neither reserves nor shorter Treasury debt would help bank earnings, which loss reserves suggest will suffer in coming quarters. Agency MBS could absorb some of the flow and could help earnings with their higher yield. Agency MBS positions did grow in March and April at a compounded annual rate of 39%.
However, do not discount the possibility that Congress will launch another round of PPP, and the prospect of that could keep banks reinvesting for now in excess reserves. The PPP program’s intention to provide forgivable lending for eight weeks might have sounded right in March when many expected the COVID-19 wave to hit the economy and quickly recede. But at this point, eight weeks looks like it will be inadequate for most eligible small businesses. The need for more PPP is there, the political precedent is set and the bank and Fed infrastructure is in place. Congress could take another approach to support small business and its owners and employees. But PPP is a path of least resistance, and a twist and a turn along banks’ path to other reinvestment assets.
* * *
The view in rates
The rates market remains in the hands of the Fed, and the Fed has convinced the market it will keep rates low for years. Futures and OIS curves now imply policy rates near the zero-bound into 2025. Every week the implied low path gets longer. QE along with other monetary and fiscal interventions of historic magnitude should keep concerns about inflation on the market agenda and keep the yield curve biased to steepen. The current 0.68% rate on 10-year Treasury debt implies an average real rate of -45 bp and inflation of 110 bp. Implied inflation has run slightly above 100 bp since mid-March.
The view in spreads
Spreads markets with Fed or fiscal support should continue tightening, and the impact of scarcity, broad liquidity, falling default and prepayment premia should tighten other debt sectors, too. Those markets now include Treasury and agency MBS, agency CMBS and investment grade corporate debt, a wide range of ABS, legacy CMBS and ‘AAA’ static CLOs.
The view in credit
Discount pricing in leveraged loans, rating agency downgrades in that market and rising bank loan loss reserves signal a wave of distressed credit. The immediate risk is from companies with high fixed costs and a sharp drop in revenue from current efforts to avoid coronavirus infection. Companies with the highest leverage are first in line. Until the arrival of pandemic, the consumer balance sheet has been extremely strong. The coming sharp rise in unemployment should change that, although the CARES Act could help cushion the blow. Nevertheless, delinquencies and defaults on mortgage and consumer loans have already started to climb quickly.