


Uncategorized
April speeds surprise but show first view of forbearance
admin | May 8, 2020
This document is intended for institutional investors and is not subject to all of the independence and disclosure standards applicable to debt research reports prepared for retail investors. This material does not constitute research.
Agency mortgage prepayments jumped in April reflecting a burst of applications to refinance in mid-March before US policymakers began shuttering large parts of the economy. Overall speeds in May in Fannie Mae and Freddie Mac MBS should drop 20% and Ginnie Mae speeds fall 10% to 15%. But most attention should fall on forbearance, where April’s results for conventional loans already signal clear emerging differences across FICO, LTV and a wide range of other characteristics.
Surprising speeds, conventional MBS outpace and Ginnie Mae
Agency prepayment speeds jumped for the second consecutive month, with Fannie Mae and Freddie Mac MBS each increasing 31% to reach 29.7 CPR and 30.6 CPR, respectively. This increase followed elevated levels of the MBA’s Mortgage Refinance Applications Index in early March (Exhibit 1). Many of these loans were able to close despite the economic shutdown and social distancing measures undertaken across much of the nation starting in the middle of March.
Exhibit 1: MBA Refinance Index
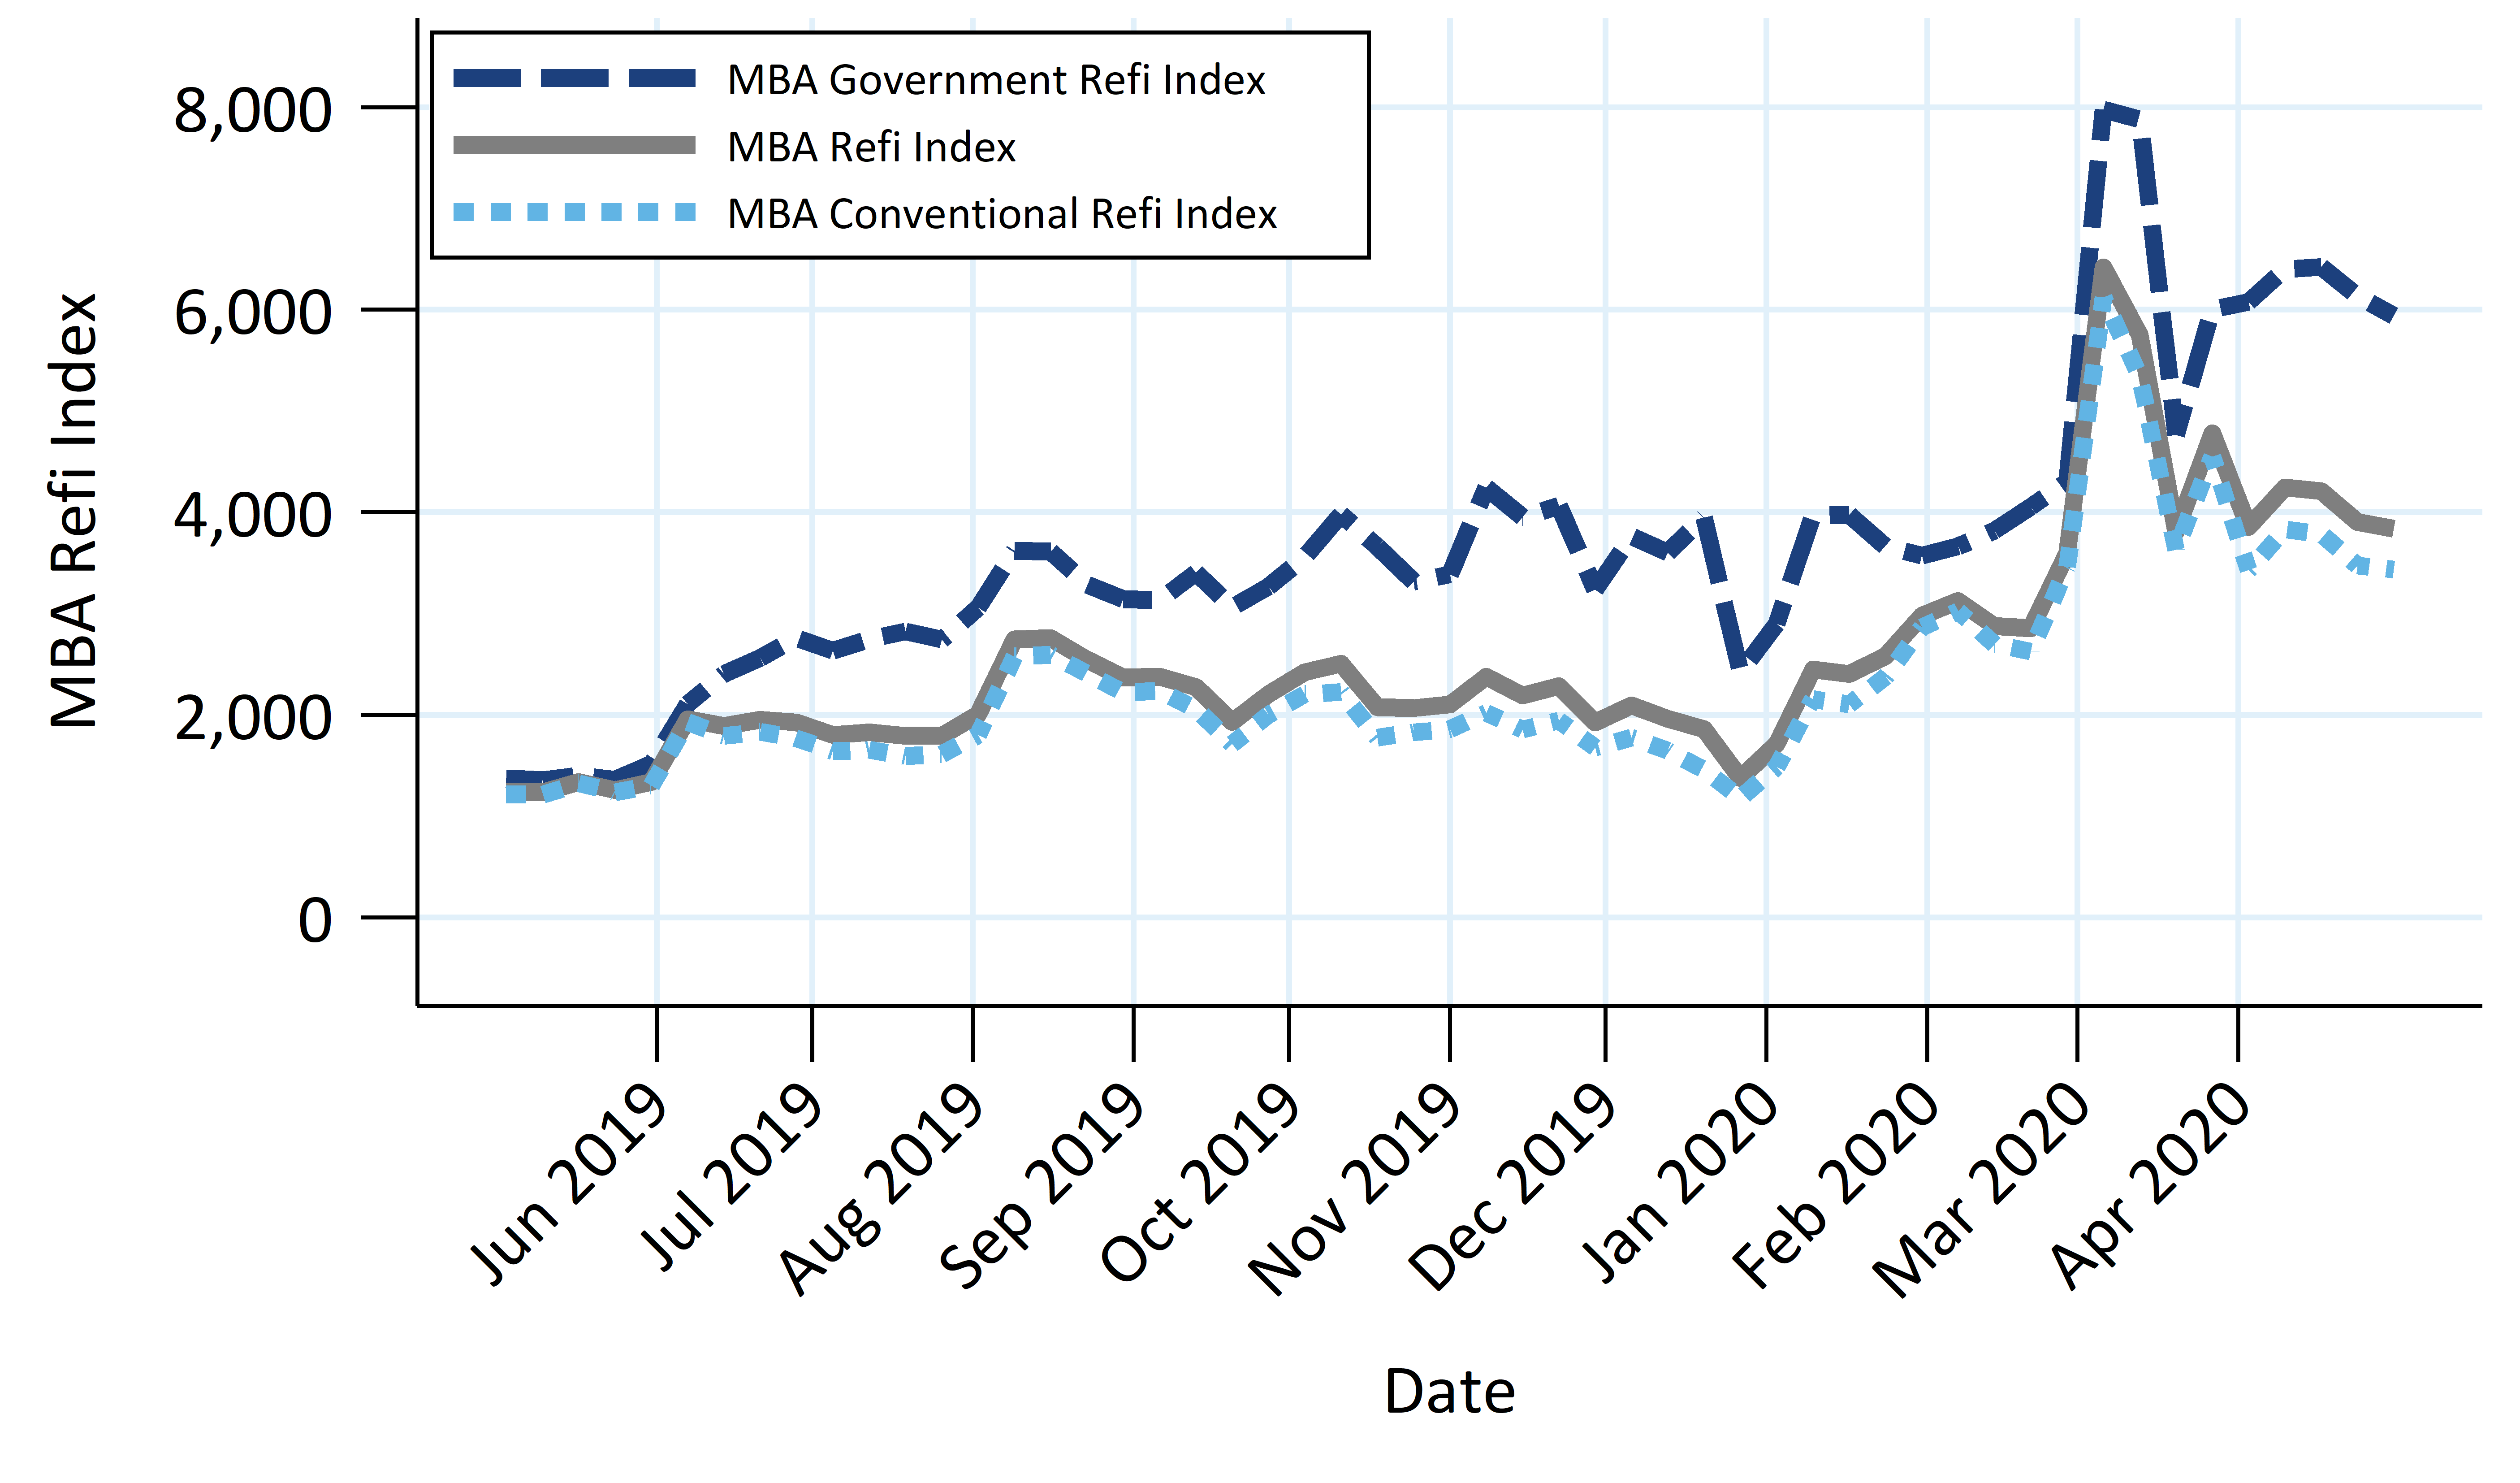
Source: Bloomberg, Amherst Pierpont Securities
Ginnie Mae MBS did not respond as strongly to the spike in the MBA index, as Ginnie Mae II MBS increased only 7% to 26.2 CPR. The gap between the conventional and government index had narrowed throughout the first three months of 2020 so it was anticipated that conventional speeds would prepay faster relative to Ginnie Mae speeds. A much larger percentage of FHA loans are being placed into forbearance plans, and the economic shutdown may have affected FHA borrowers earlier than conventional borrowers, further suppressing speeds relative to conventionals.
A refi burst not fully explained by mortgage rates
While primary mortgage rates fell to a new low in early March, according to Freddie Mac’s survey, the level of refi activity far outpaced activity expected for that level of rates (Exhibit 2). The four readings in March were all much higher than other times rates were at similar levels. This could indicate that loan officers were extremely active soliciting business since there was a lot of risk that COVID-19 might disrupt originations later. It is also possible that the surveyed mortgage rates did not accurately represent the rates that borrowers received.
There were some indicators that mortgage originators were having difficulty processing loans in March and early April, which might have resulted in speeds coming in below levels suggested by the index. But those frictions proved to have little effect on speeds. For example, the index represents mortgage applications, not rate locks. But some originators were making borrowers proceed further in the refinancing process before locking rates, which could have resulted in a higher fall-out rate if borrowers missed the lowest rates.
Exhibit 2: MBA Refinance Index vs. 30 Year Mortgage Rate
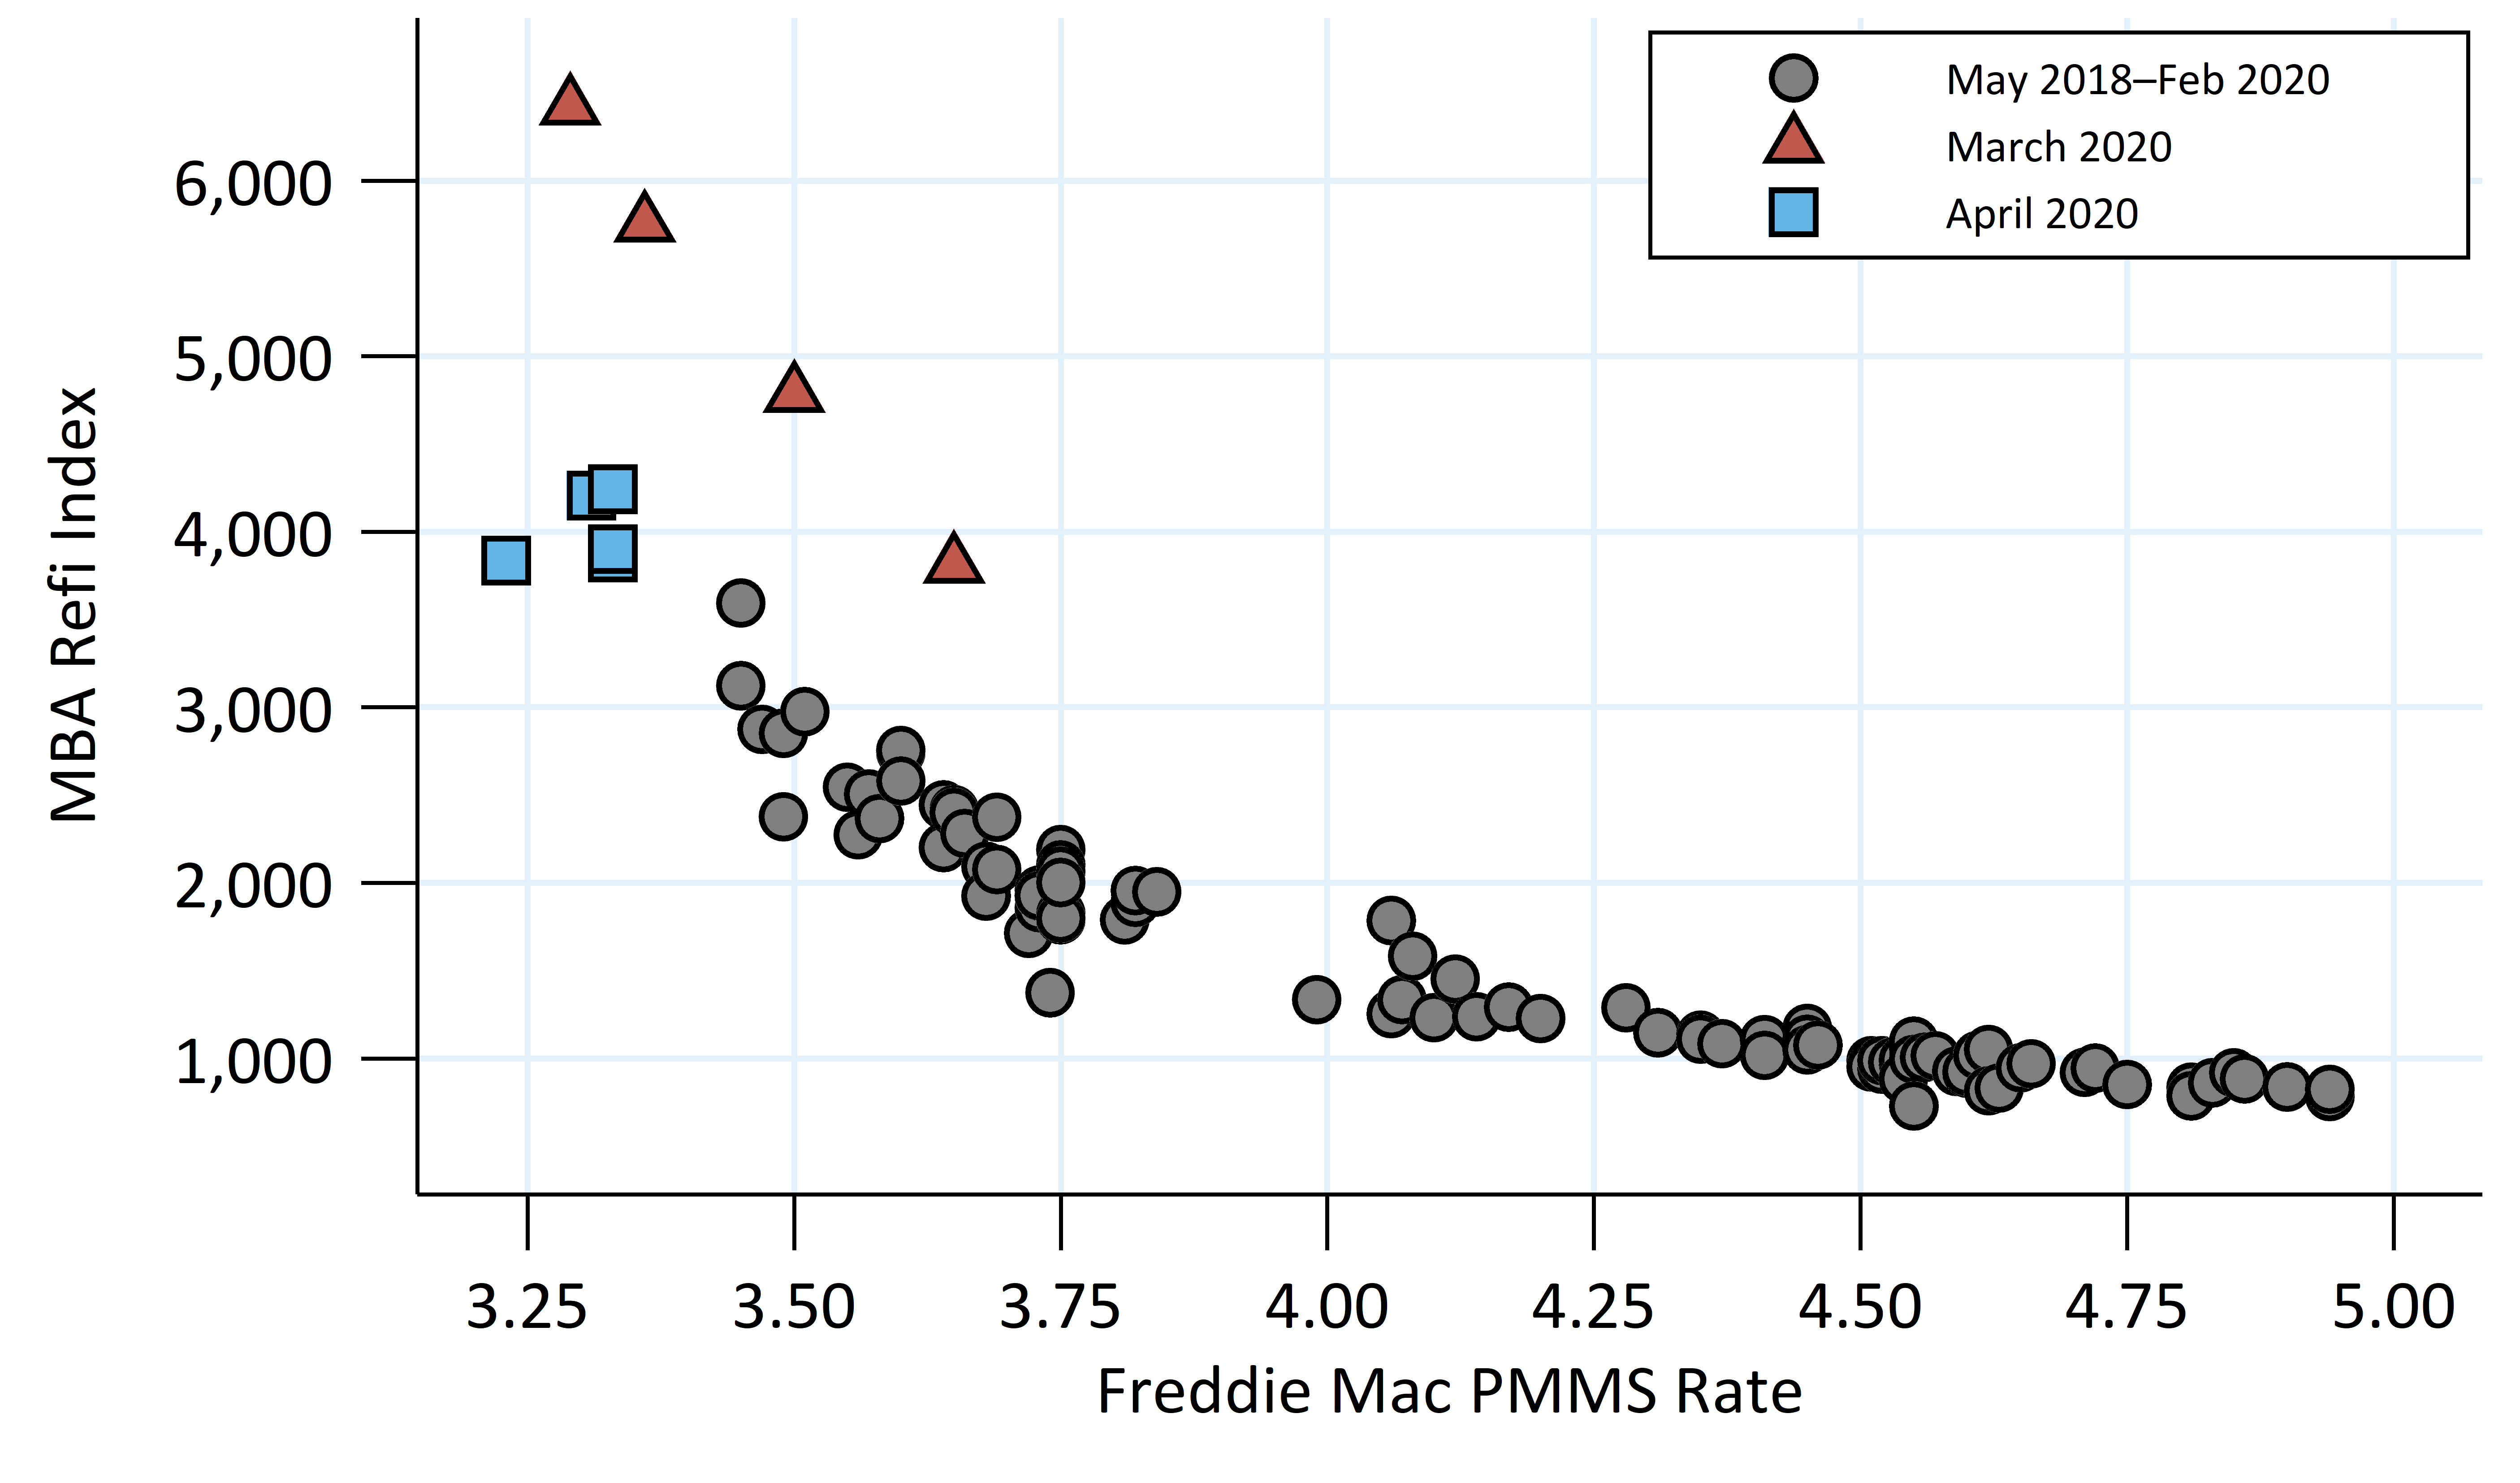
Source: Bloomberg, Amherst Pierpont Securities
Conventional MBS should slow faster than Ginnie Mae in May
The relationship between the refi index and primary mortgage rate appears to have returned to typical levels after March. The mortgage rate has fallen back to the levels of early March, but the index is over 2,000 points lower than early March. This suggests that speeds should fall significantly, around 20% in May for conventionals.
However, the gap between the Ginnie Mae and conventional index has widened. Ginnie Mae refinance activity should fall next month, but probably not as much as conventionals. Reviewing the MBA’s individual FHA and VA refinance indices shows that most of the spike in government applications in early March came from VA loans, while FHA applications didn’t jump nearly as much initially but have trended slowly higher throughout April. Expect VA speeds to slow comparably to conventionals. FHA loans are also likely to slow, but mostly due to the build-up in forbearance, so the drop may not be as sharp as in VA loans. Expect Ginnie speeds to slow 10% to 15% overall.
A full table of April prepayment speeds by agency an pass-through coupon is at the end of this article.
A first look at new conventional delinquency rates
The level of forbearance should have a significant effect on MBS valuations over the coming months. While the GSEs will not start disclosing details about the number of loans in forbearance until next month, the increase in 30-day delinquent loans this month sends a first signal about the impact. Freddie Mac provides this data for all pools, while Fannie Mae only does for those issued in November 2018 and later. Fannie Mae is going to expand this data to cover all pools next month.
Also, servicers have indicated that many borrowers made their April 1 payment before requesting forbearance. It is possible this is because many borrowers have their mortgage payment automatically deducted from their bank accounts each month. Delinquency data should lag the forbearance data reported from other sources. For example, the MBA stated that 5.85% of GSE loans in forbearance on April 26, but the average 30-day delinquency rate is only 3.97% in Fannie Mae pools and 3.75% in Freddie Mac pools.
Lower FICO loans had the largest increases in delinquency rates
Pools with lower average FICO scores had larger increases in delinquencies than those with higher FICO scores (Exhibit 3). This is consistent with analysis of conventional delinquency rates from 2008 and 2009, which suggested low FICO borrowers would be more heavily affected. Loans below 700 FICO, often pooled separately, saw nearly an additional 6% of loans become delinquent this month. Pools with average FICO scores between 700 and 720 jumped comparably, while pools with FICO scores over 760 only increased 2.36%. Since lower FICO pools already had higher 30-day delinquency rates to begin with, these pools have exceeded 8% total delinquent loans.
Exhibit 3: Forbearance likely drove delinquencies up in lower FICO loans
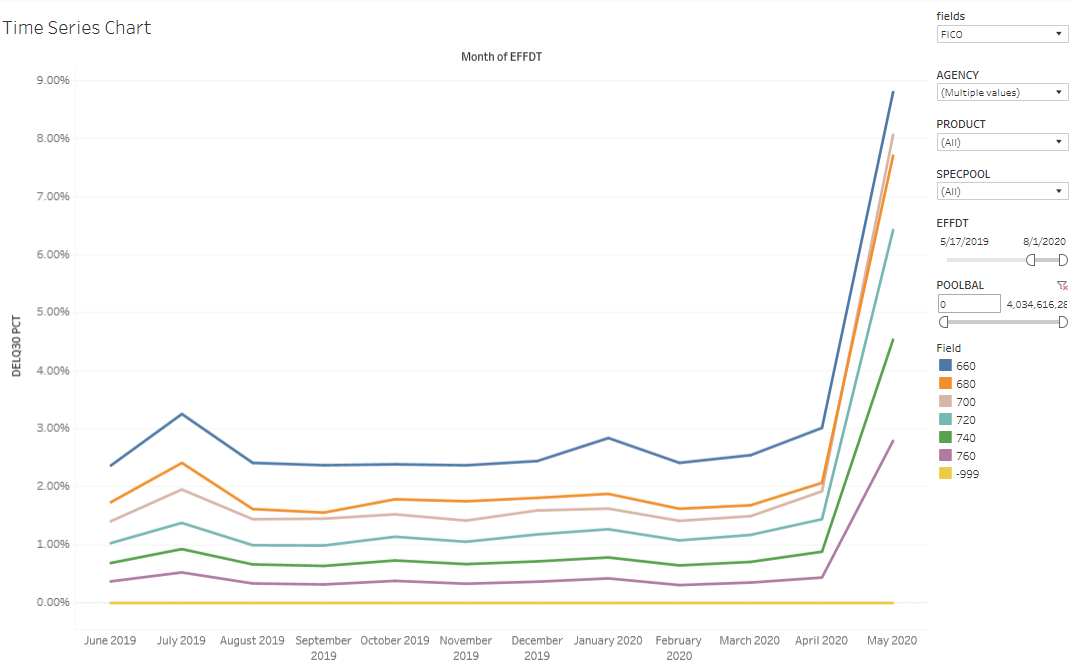
Source: Fannie Mae, Freddie Mac, Amherst Pierpont Securities
Some of the difference could be explained by higher FICO borrowers having more reserves and therefore were more likely to make their April payment. If so then the forbearance rates might converge over time as more data is released.
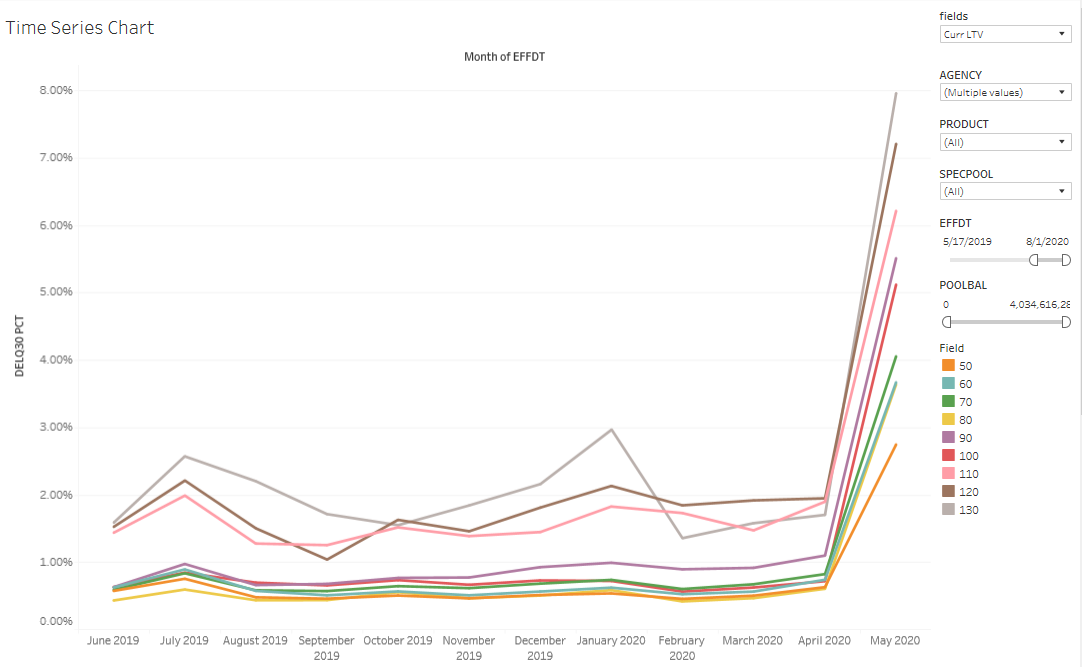
Higher mark-to-market LTV pools also added more delinquent loans
Pools with higher mark-to-market LTVs also generally showed a larger increase in delinquency rates than those with lower LTVs (Exhibit 4). This is also consistent with delinquency rates observed in 2008 and 2009. The data is a little noisier for LTV, but it is possible that this is due to the approximation of calculating current LTVs on pools. If the analysis were possible to do at the loan-level with this data then the pattern might be even clearer.
Exhibit 4: Forbearance likely drove delinquencies up in higher LTV loans
Source: Fannie Mae, Freddie Mac, Amherst Pierpont Securities
Higher SATO pools also had larger increases in delinquent loans
Pools with a higher spread-at-origination (SATO) also tended to add more delinquent loans this month (Exhibit 5). SATO is another indicator of a borrower’s credit—high SATO loans were charged more credit fees, which were funded by originating the loan at a higher rate. But SATO can incorporate credit information that isn’t otherwise represented in FICO and LTV.
Exhibit 5: Forbearance likely drove delinquencies up in higher SATO loans
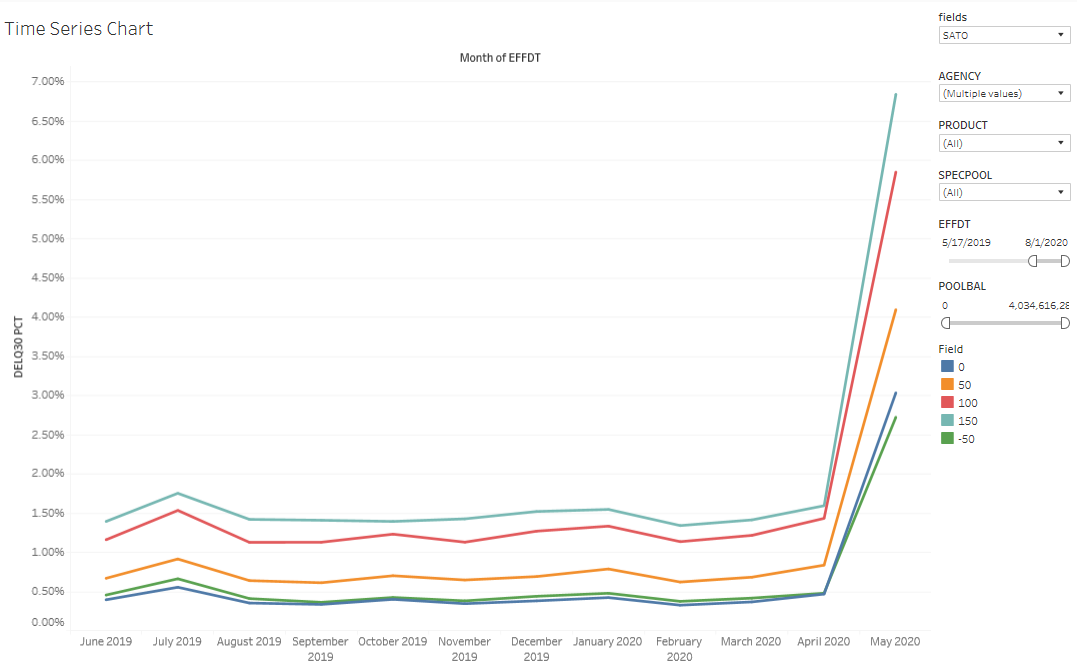
Source: Fannie Mae, Freddie Mac, Amherst Pierpont Securities
New York pools showed a sharp increase in delinquency rates
Analyzing delinquencies by state is difficult with pool level data, since it is constrained by the handful of states that are pools as separate spec pools. And these pools usually only contain the higher balance loans from those states. New York loans are often pools separately, and this state became the epicenter of the COVID infection in the United States. The data shows a large increase in delinquency rates in New York pools; the pools with a larger share of New York loans had a larger increase in delinquency rates (Exhibit 6).
Exhibit 6: Forbearance likely drove delinquencies up in New York pools
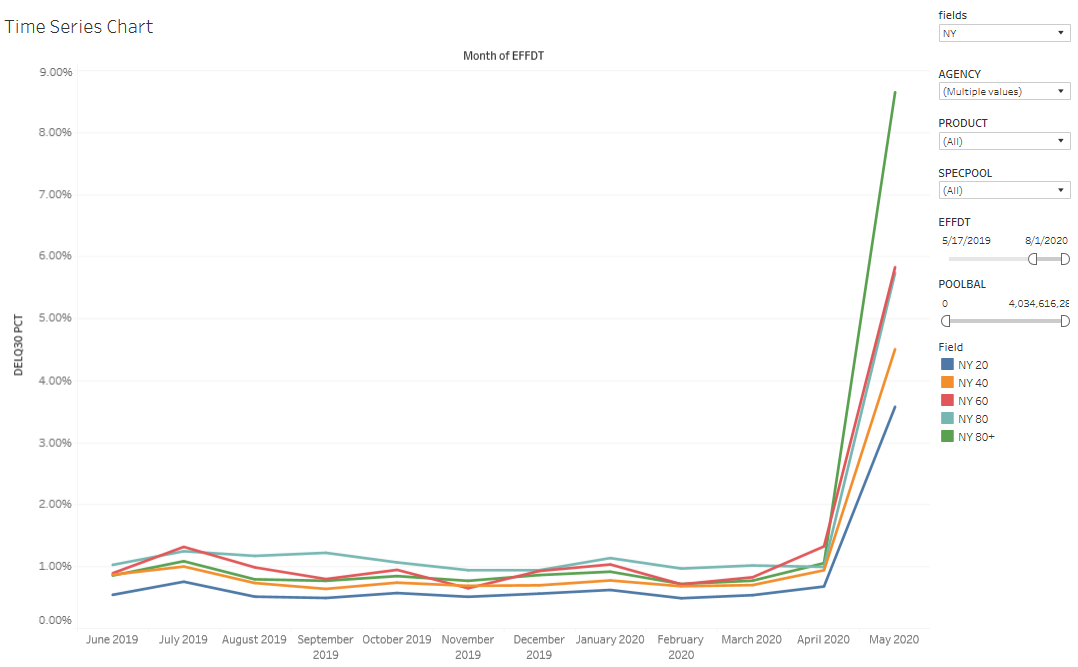
Source: Fannie Mae, Freddie Mac, Amherst Pierpont Securities
More investor loans became delinquent in April
Investor loans are often pooled separately, and those pools had similar delinquency rates to the non-investor pools prior to April. However, over the month of April roughly 4.5% additional loans in investor pools became delinquent, compared to only 3% extra in other pools (Exhibit 7). Investors might be more willing to seek forbearance on the investment property before their primary home. They may also be more exposed to a loss of either their personal income and/or rental income.
Exhibit 7: Forbearance likely drove delinquencies up in investor pools
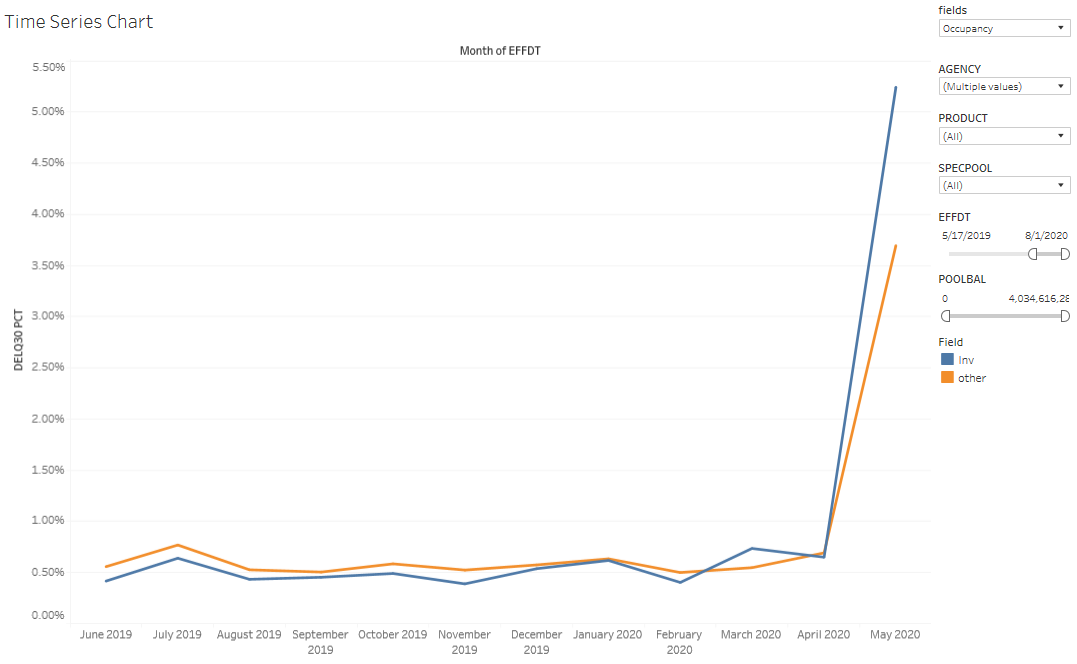
Source: Fannie Mae, Freddie Mac, Amherst Pierpont Securities
Higher rate loans also added more delinquencies this month
Loans with higher note rates tend to be less affordable, and more borrowers stopped paying these loans in April. Loans backing higher coupons showed higher delinquencies (Exhibit 8). Note that higher rate pools are generally more correlated with lower FICO scores and higher SATO, so this may be picking up some of the difference due to borrower credit characteristics as well.
Exhibit 8: Forbearance likely drove delinquencies up in higher-coupon pools
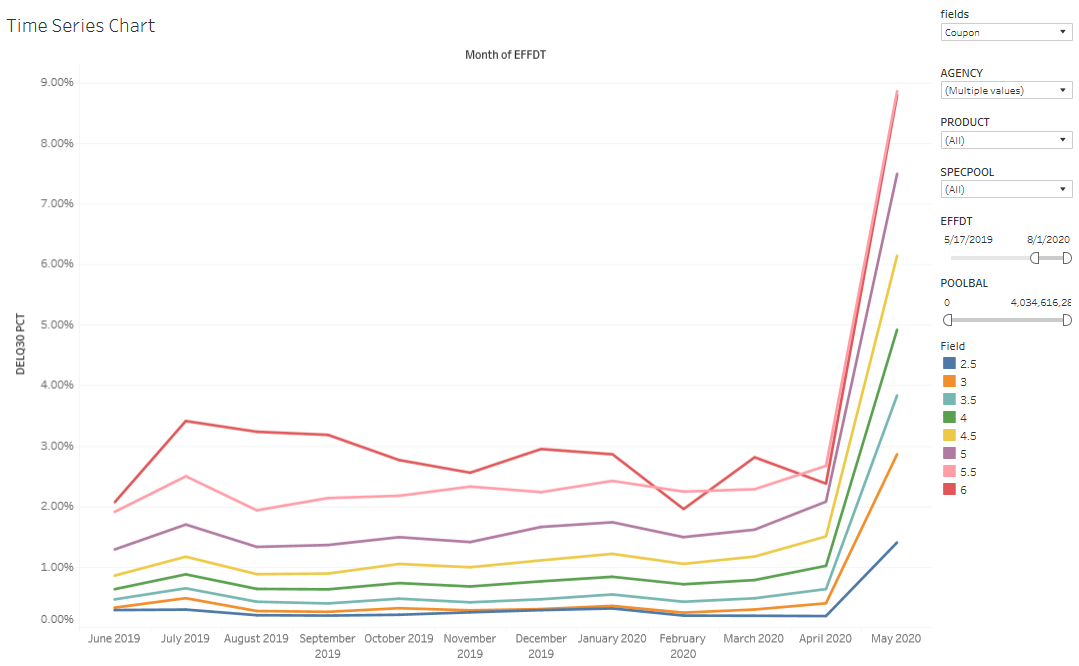
Source: Fannie Mae, Freddie Mac, Amherst Pierpont Securities
Higher balance loans added more delinquencies
Higher balance loans also had larger jumps in delinquency rates in April (Exhibit 9). Prior to April these pools tended to be lower delinquency. However, in 2008 and 2009 higher balance loans had substantially higher delinquency rates than lower balance loans, so this appears consistent with that pattern. While larger loans tend to come from states more heavily affected by COVID such as New York and California, in the non-agency space a similar analysis excluding those states uncovered this same trend.
Exhibit 9: Forbearance likely drove delinquencies up in higher loan balances
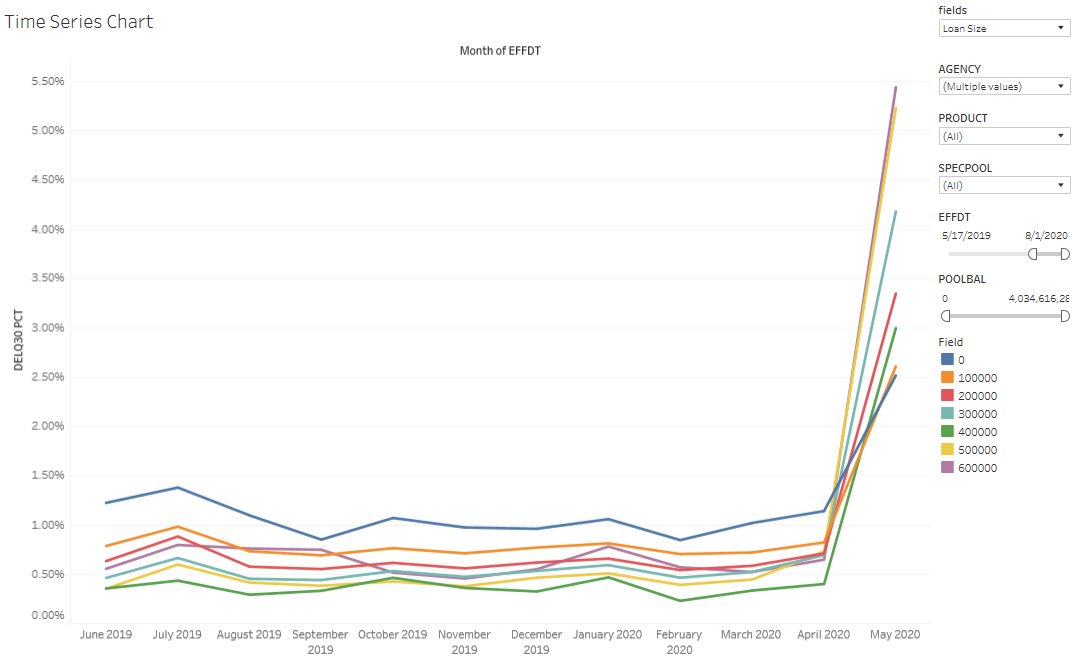
Source: Fannie Mae, Freddie Mac, Amherst Pierpont Securities
Servicer matters, too
Some originators were earlier to ramp up efforts and systems for placing borrowers on forbearance, while other have had significant difficulty processing the volume of borrowers requesting help. This disparity shows up in the delinquency data. Wells Fargo, for example, had one of the largest increases in delinquencies. Provident, on the other hand, only has 2% of their loans in delinquency at the end of April. This also suggests that the delinquency rates observed this month will be strongly correlated with the eventual forbearance rates that are reported. Otherwise servicer-specific differences would likely be more muted because a borrower can stop paying regardless of whether they are placed on forbearance. Instead, it seems that some borrowers that can’t get through their servicer may be more likely to make their payment in the interim, maybe due to automatic deductions.
More seasoned loans tend to have lower increases in delinquency rates
In general, newer vintage loans were more likely to stop paying in April. There are also other collateral attributes that vary with vintage that likely play a role. Many seasoned vintages have much lower mark-to-market LTVs, for example, through a combination of home price appreciation and amortization. These loans have probably become more affordable for their borrowers, assuming there has been income growth since the loan was originated.
Exhibit 10: Forbearance likely drove differences in delinquency across vintage
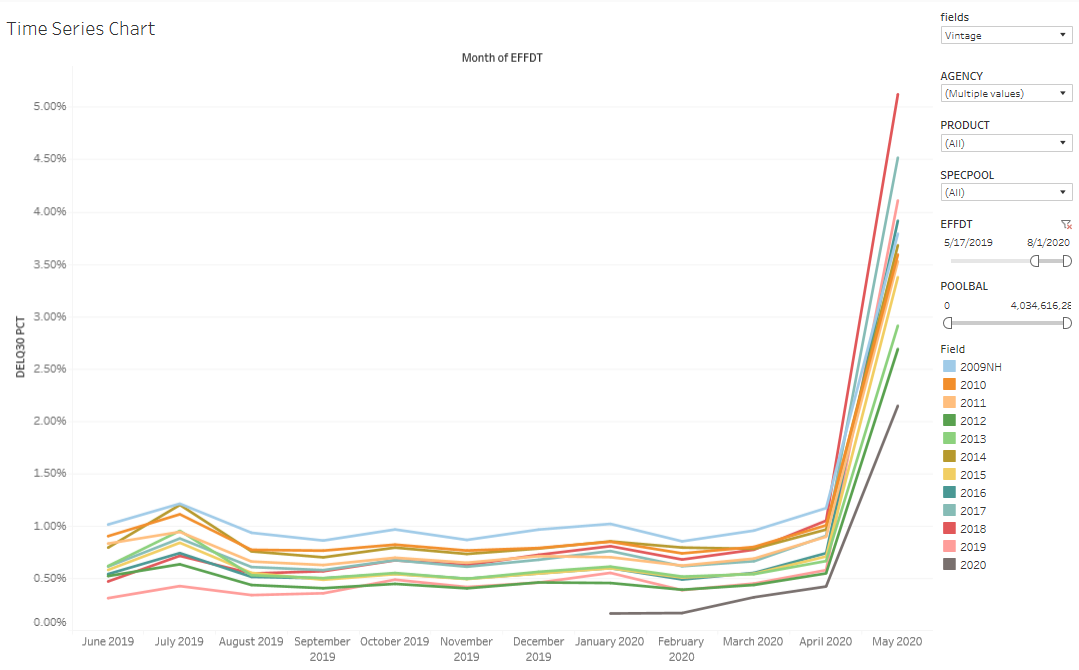
Source: Fannie Mae, Freddie Mac, Amherst Pierpont Securities
Thanks to the APS Data and Analytics team for support in this analysis.
