


Uncategorized
A punishing performance for managers through April
admin | May 8, 2020
This document is intended for institutional investors and is not subject to all of the independence and disclosure standards applicable to debt research reports prepared for retail investors. This material does not constitute research.
Most CLO managers in the three months ending in April brought knives to the gunfight. The average CLO leveraged loan portfolio lost 13.15% and, after adjusting for broad market exposure, or beta, underperformed the market by 0.30%. Managers with more than $5 billion in active CLOs tended to do better than average, and managers starting February with stronger loans and good liquidity tended to do better, too. Adequate manager size, strong loans and good liquidity have distinguished better performers throughout the last year, so the trend continues. Although no managers avoided losses, some of the stronger performers among larger names over the short and long run include Palmer Square, Neuberger Berman, CIFC, Onex and Apollo.
A full list of large manager returns and attribution from February through April is available from your APS sales representative.
Returns on leveraged loans from late February to late March took their worst beating in years before rebounding in April (Exhibit 1). CLO managers report throughout each month, so the reporting date makes a significant difference in volatile markets. Accounting for reporting dates among managers with five or more active deals, the S&P/LSTA index from February through April lost 12.59%. These managers carried portfolios with an average beta of 1.02, which should have put the average manager loss at 12.85%. With actual performance at 13.15%, the average manager underperformed by 0.30%.
Exhibit 1: Loan returns fell in February and March but bounced in April

Source: Bloomberg, Amherst Pierpont Securities
Although average performance lagged the index after accounting for beta, 15 of the 65 larger managers, or 23%, outperformed (Exhibit 2). That contrasts sharply with the last 3-month performance period ending before loans prices fell, where 66% of these larger managers outperformed.
Exhibit 2: Most managers lagged the index February-March but 23% led

Note: data shows excess return only for active deals. Source: Amherst Pierpont Securities
Higher average portfolio loan prices at the start of February, greater bid depth and a the amount of CLO assets under management all correlated with better excess return from February through March (Exhibit 3). The managers’ track record of steadily producing excess return over their entire history—their information ratio—also had a small positive correlation. These factors helped lift excess return in CLO portfolios last year, too. Indicators of lower loan quality such as weighted average rating factor, spread and ‘CCC’ share correlated negatively with excess return.
Exhibit 3: Correlation of portfolio or manager features with recent excess return
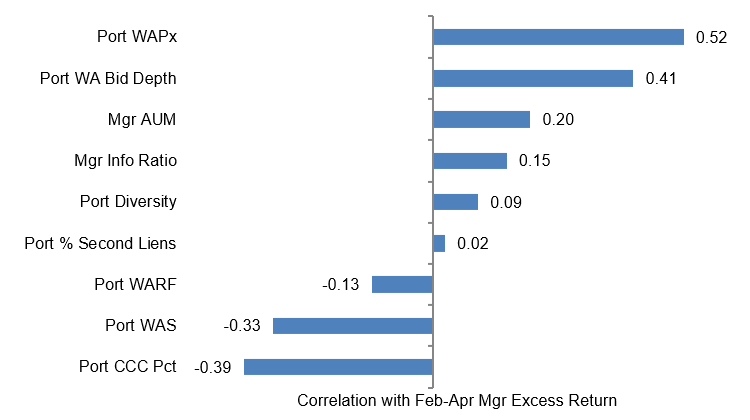
Note: data shows the correlation of manager or loan portfolio attribute with managers’ excess return or alpha from February through April only on active deals. Portfolio attributes measured as percentiles. Source: Amherst Pierpont Securities.
The market since May 2019 has generally punished most CLO managers. The distribution of information ratios, which measures the stability of a manager’s excess returns over the life of the platform, has drifted lower and the median has dropped from 0.10 to 0.06 (Exhibit 4). Many managers delivered steady excess return from early 2016 through mid-2018 as leveraged loan prices rallied but have lagged the market since loan prices became more volatile, sometimes dragging their information ratio sharply lower. The average manager at the end of April showed life-to-date excess return of only 1.7 bp.
Exhibit 4: The last year has eroded most managers’ record of excess returns
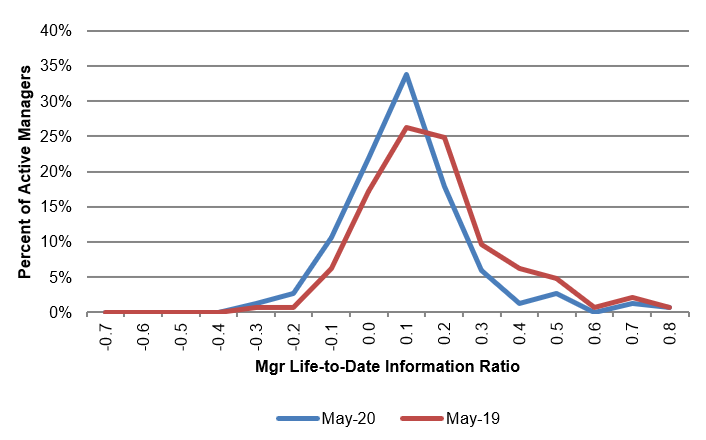
Note: Data shows information ratios for all active managers at each date regardless of number of expired or active deals. Source: Amherst Pierpont Securities
Despite challenging markets, a handful of managers showed excess return even during February through April and life-to-date track records above the median. Those include Palmer Square, Neuberger Berman, CIFC Asset Management, Onex, Apollo Global, Goldentree, Blackrock, Ares, Oaktree and DFG (Exhibit 5).
Exhibit 5: Alpha leaders in CLO portfolio performance February-April 2020

Note: Performance for managers with five or more deals tracked by APS. Performance attribution starts with calculated total return on the leveraged loan portfolio held in each CLO for the 3-month reporting period ending on the indicated date. CLOs, even with a single manager platform, may vary in reporting period. The analysis matches performance in each period to performance over the identical period in the S&P/LSTA Leveraged Loan Index. Where a deal has at least 18 months of performance history since pricing and no apparent errors in cash flow data, the analysis calculates a deal beta. The deal beta is multiplied by the index return to predict deal return attributable to broad market performance. Where no beta can be calculated, the analysis uses the average beta across each manager’s active deals weighted by the average deal principal balance over time. Any difference between performance attributable to beta and actual performance is attributed to manager alpha. Source: Amherst Pierpont Securities.