Uncategorized
A likely muted impact of COVID-19 on legacy RMBS
admin | May 8, 2020
This material is a Marketing Communication and does not constitute Independent Investment Research.
The potential impact of COVID-19 on borrower and servicer behavior in legacy RMBS suggests a muted impact on security performance even under fairly harsh stresses. Low mark-to-market LTVs, existing trends in making payments and a history of post-modification performance are likely tailwinds to continued relatively strong fundamental performance, potentially making legacy RMBS a more attractive way to express a view in mortgage credit than other sectors.
Given the relatively unique potential impact of COVID-19, stressing borrowers’ probability of making payments appears to be a reasonable approach to estimating both borrower and servicer behavior and ultimate defaults and losses across loans in legacy RMBS. The approach assumes a 20% decrease in payment probability for all loans for a period of six months. The COVID-19 overlay additionally assumes zero prepayments and no loans rolling to foreclosure, REO or liquidation for the same six months. Even with a 20% reduction in payment probability and other adjustments, the estimated impact on loan prices is quite modest, just $3.50 on average, representing a 4.3% price decrease between a base case run with no overlays and a stressed run across a universe of nearly $275 billion in collateral. (Exhibit 1)
Exhibit 1: A substantial slowdown in payment probability yields modest loan price changes
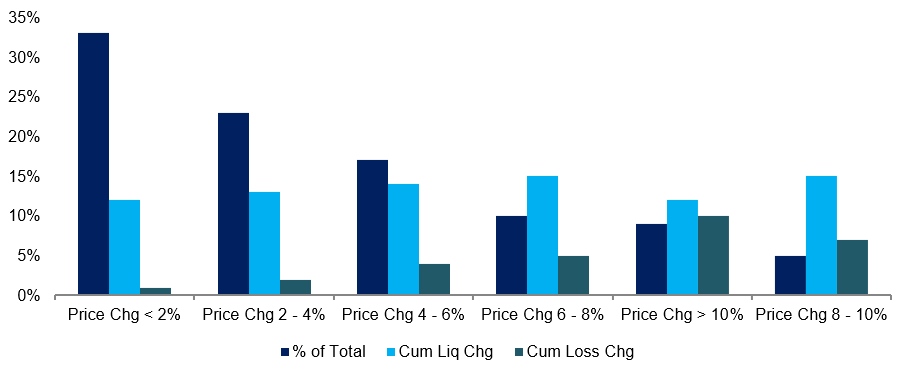
Note: Data shows the percent of priced loans showing each category of price change. Loans are priced using a 6% yield to discount projected back case cash flows, and repriced using a 6% yield for scenario cash flows. Estimates as of 5/4/2020. Source: Amherst Insight Labs, Amherst Pierpont Securities.
Not all loans respond to projected payment stress the same way. On average, loans backing subprime trusts fell 5.8% while prime, Alt-A and Option ARM loans all fell in the neighborhood of 3.0% (Exhibit 2). Subprime loans had the largest tail of loans with outsized price declines as roughly 13% of subprime collateral saw a greater than 10% price decline in the COVID-19 overlay, roughly double the amount of loans with large price declines in Alt-A and Option ARM credits. Liquidation rates on subprime loans with the largest price declines increased from 33% to 47% in the COVID-19 overlay, driving cumulative losses on the loans from 23% 32%. The outsized increase in defaults was likely driven by higher average mark-to-market LTVs and more recent modifications on the tail of subprime loans versus other cohorts.
Exhibit 2: Subprime collateral has the largest tail of loans with large price declines
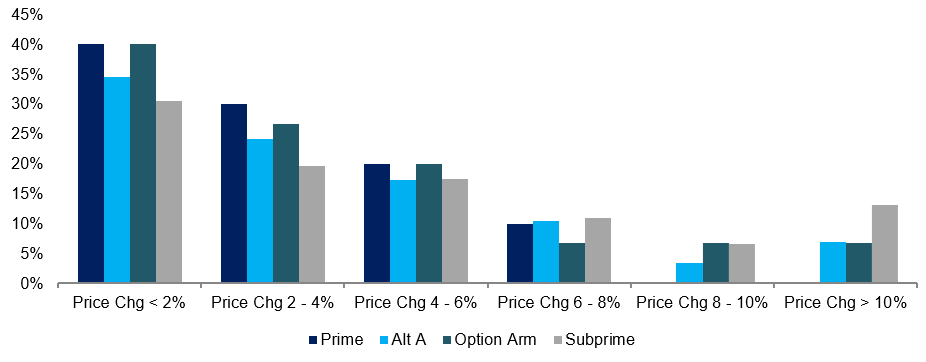
Note: Data shows the percent of priced loans showing each category of price change. Loans are priced using a 6% yield to discount projected back case cash flows, and repriced using a 6% yield for scenario cash flows. Estimates as of 5/4/2020. Distribution is scaled to 100% of each discrete loan type. Source: Amherst Insight Labs, Amherst Pierpont Securities.
As a result of the COVID-19 related overlays, the percentage of legacy loans liquidated increased from 18% to 30% of the universe. This was largely driven by an increased amount of always performing loans being pushed to liquidation due to the slowdown in payment probability. Comparing the population of loans with the smallest change in liquidations to the cohort with the largest change shows the population of loans with the smallest increase in liquidations was comprised of just 1% always performing loans and 86% non-performing loans while the bucket with the largest increase was comprised of nearly 40% always performing loans and no non-performing ones. (Exhibit 3) This illustrates the impact of the slowdown in payment velocity as it will have a much more outsized impact on a loan that otherwise would have had a very high probability of remaining always current in the base case scenario.
Exhibit 3: Changes to payment velocity push more APLs to liquidation
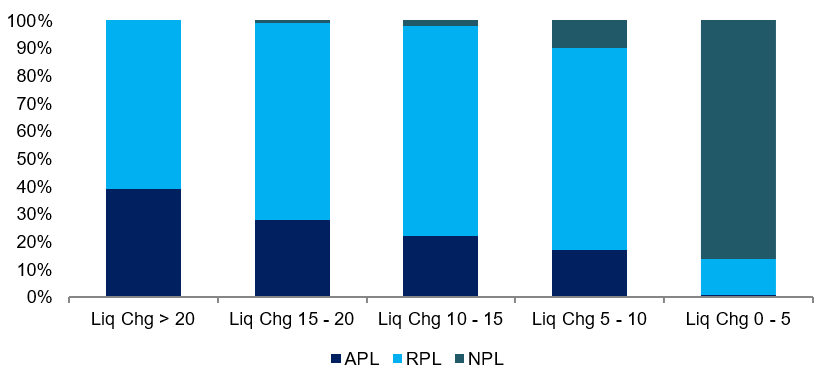
Source: Amherst Insight Labs, Amherst Pierpont Securities as of 05/04/20
The percentage of increased liquidations were fairly evenly distributed across loan types as roughly the same percentage of prime collateral saw large spikes in liquidations as those seen in subprime loans. (Exhibit 4) Looking at the worst performing buckets of prime and subprime collateral show roughly 25% increases in the amount of loans liquidated in both cohorts. In both cohorts, the worst performing bucket contains no non-performing loans. Given the large concentration of always performing loans in the prime bucket, the increase in liquidations is much more pronounced on a percentage basis as liquidations jumped from 5% to 25%. Base case liquidations in the subprime cohort with a much smaller amount of always performing loans grew from 15% in the base case versus 40% with the COVID-19 overlays.
Exhibit 4: Increases in liquidations are evenly distributed across cohorts
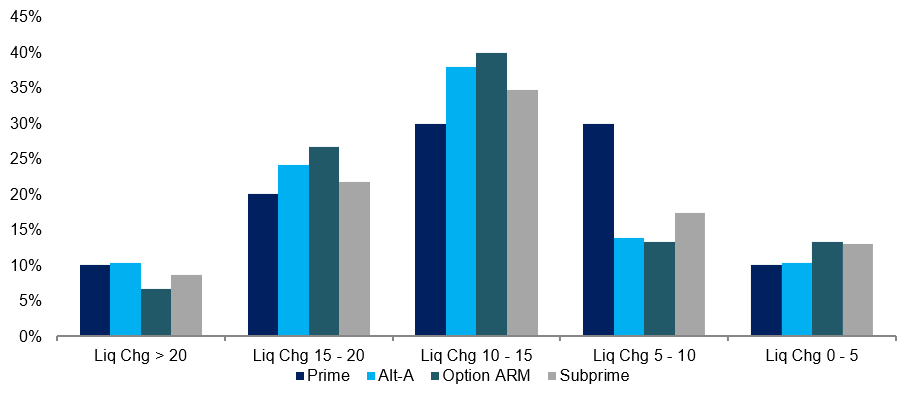
Note: Data shows the percent of priced loans showing each category of price change. Loans are priced using a 6% yield to discount projected back case cash flows, and repriced using a 6% yield for scenario cash flows. Estimates as of 5/4/2020. Distribution is scaled to 100% of each discrete loan type. Source: Amherst Insight Labs, Amherst Pierpont Securities.
Even with large spikes in payment velocity related liquidations, projected cumulative losses are small. Cumulative losses rise by just 3% across the universe of legacy loans as a result of the reduction in payment velocity and other COVID-19 related overlays. This is largely a function of lower LTV loans pushed to liquidation as a result of the payment velocity overlay. Low cumulative losses are largely a result of lower LTV loans liquidating that otherwise would have not absent the slowdown in payment velocity. At the universe level, liquidated loans had an average mark-to-market LTV of 55. As a result of this, loss severities on average decline by six points from 42 to 36 between the base case and COVID-19 scenarios. The decline in severities is driven by the fact that many of the loans being pushed into liquidation in the COVID-19 scenario will ultimately liquidate without a loss, effectively looking more like a prepayment out of the non-performing loan pipeline or ‘no-loss liquidation.’
So despite what optically appear to be harsh stresses on borrower behavior, it appears that COVID-19 may be much more of an extension event in terms of modification than a default-and-loss event for legacy collateral. Capital structure leverage will still matter, and even a modest uptick in cumulative losses or decline in excess spread from rate modifications could have an outsized impact on thinner mezzanine bonds with no credit support and significant leverage to excess spread. So while COVID-19 may have a marginal impact on legacy collateral as a whole, its impact will not be zero and levered profiles may need to reprice accordingly.
This material is intended only for institutional investors and does not carry all of the independence and disclosure standards of retail debt research reports. In the preparation of this material, the author may have consulted or otherwise discussed the matters referenced herein with one or more of SCM’s trading desks, any of which may have accumulated or otherwise taken a position, long or short, in any of the financial instruments discussed in or related to this material. Further, SCM may act as a market maker or principal dealer and may have proprietary interests that differ or conflict with the recipient hereof, in connection with any financial instrument discussed in or related to this material.
This message, including any attachments or links contained herein, is subject to important disclaimers, conditions, and disclosures regarding Electronic Communications, which you can find at https://portfolio-strategy.apsec.com/sancap-disclaimers-and-disclosures.
Important Disclaimers
Copyright © 2026 Santander US Capital Markets LLC and its affiliates (“SCM”). All rights reserved. SCM is a member of FINRA and SIPC. This material is intended for limited distribution to institutions only and is not publicly available. Any unauthorized use or disclosure is prohibited.
In making this material available, SCM (i) is not providing any advice to the recipient, including, without limitation, any advice as to investment, legal, accounting, tax and financial matters, (ii) is not acting as an advisor or fiduciary in respect of the recipient, (iii) is not making any predictions or projections and (iv) intends that any recipient to which SCM has provided this material is an “institutional investor” (as defined under applicable law and regulation, including FINRA Rule 4512 and that this material will not be disseminated, in whole or part, to any third party by the recipient.
The author of this material is an economist, desk strategist or trader. In the preparation of this material, the author may have consulted or otherwise discussed the matters referenced herein with one or more of SCM’s trading desks, any of which may have accumulated or otherwise taken a position, long or short, in any of the financial instruments discussed in or related to this material. Further, SCM or any of its affiliates may act as a market maker or principal dealer and may have proprietary interests that differ or conflict with the recipient hereof, in connection with any financial instrument discussed in or related to this material.
This material (i) has been prepared for information purposes only and does not constitute a solicitation or an offer to buy or sell any securities, related investments or other financial instruments, (ii) is neither research, a “research report” as commonly understood under the securities laws and regulations promulgated thereunder nor the product of a research department, (iii) or parts thereof may have been obtained from various sources, the reliability of which has not been verified and cannot be guaranteed by SCM, (iv) should not be reproduced or disclosed to any other person, without SCM’s prior consent and (v) is not intended for distribution in any jurisdiction in which its distribution would be prohibited.
In connection with this material, SCM (i) makes no representation or warranties as to the appropriateness or reliance for use in any transaction or as to the permissibility or legality of any financial instrument in any jurisdiction, (ii) believes the information in this material to be reliable, has not independently verified such information and makes no representation, express or implied, with regard to the accuracy or completeness of such information, (iii) accepts no responsibility or liability as to any reliance placed, or investment decision made, on the basis of such information by the recipient and (iv) does not undertake, and disclaims any duty to undertake, to update or to revise the information contained in this material.
Unless otherwise stated, the views, opinions, forecasts, valuations, or estimates contained in this material are those solely of the author, as of the date of publication of this material, and are subject to change without notice. The recipient of this material should make an independent evaluation of this information and make such other investigations as the recipient considers necessary (including obtaining independent financial advice), before transacting in any financial market or instrument discussed in or related to this material.
Important disclaimers for clients in the EU and UK
This publication has been prepared by Trading Desk Strategists within the Sales and Trading functions of Santander US Capital Markets LLC (“SanCap”), the US registered broker-dealer of Santander Corporate & Investment Banking. This communication is distributed in the EEA by Banco Santander S.A., a credit institution registered in Spain and authorised and regulated by the Bank of Spain and the CNMV. Any EEA recipient of this communication that would like to affect any transaction in any security or issuer discussed herein should do so with Banco Santander S.A. or any of its affiliates (together “Santander”). This communication has been distributed in the UK by Banco Santander, S.A.’s London branch, authorised by the Bank of Spain and subject to regulatory oversight on certain matters by the Financial Conduct Authority (FCA) and the Prudential Regulation Authority (PRA).
The publication is intended for exclusive use for Professional Clients and Eligible Counterparties as defined by MiFID II and is not intended for use by retail customers or for any persons or entities in any jurisdictions or country where such distribution or use would be contrary to local law or regulation.
This material is not a product of Santander´s Research Team and does not constitute independent investment research. This is a marketing communication and may contain ¨investment recommendations¨ as defined by the Market Abuse Regulation 596/2014 ("MAR"). This publication has not been prepared in accordance with legal requirements designed to promote the independence of research and is not subject to any prohibition on dealing ahead of the dissemination of investment research. The author, date and time of the production of this publication are as indicated herein.
This publication does not constitute investment advice and may not be relied upon to form an investment decision, nor should it be construed as any offer to sell or issue or invitation to purchase, acquire or subscribe for any instruments referred herein. The publication has been prepared in good faith and based on information Santander considers reliable as of the date of publication, but Santander does not guarantee or represent, express or implied, that such information is accurate or complete. All estimates, forecasts and opinions are current as at the date of this publication and are subject to change without notice. Unless otherwise indicated, Santander does not intend to update this publication. The views and commentary in this publication may not be objective or independent of the interests of the Trading and Sales functions of Santander, who may be active participants in the markets, investments or strategies referred to herein and/or may receive compensation from investment banking and non-investment banking services from entities mentioned herein. Santander may trade as principal, make a market or hold positions in instruments (or related derivatives) and/or hold financial interest in entities discussed herein. Santander may provide market commentary or trading strategies to other clients or engage in transactions which may differ from views expressed herein. Santander may have acted upon the contents of this publication prior to you having received it.
This publication is intended for the exclusive use of the recipient and must not be reproduced, redistributed or transmitted, in whole or in part, without Santander’s consent. The recipient agrees to keep confidential at all times information contained herein.


