Uncategorized
The market impact of a very certain Fed
admin | May 1, 2020
This material is a Marketing Communication and does not constitute Independent Investment Research.
The market has largely priced in the predictable effects of the Fed on the US Treasury and agency MBS and CMBS markets but still has room to run as the Fed refines its efforts on credit. Stronger balance sheets in high yield and leveraged loans stand to gain the most. Agency MBS has upside from rising levels of forbearance.
The Treasury market at this point should know what to expect from the Fed: good liquidity, low rates and stable-to-rising implied inflation. Steady QE has largely restored normal liquidity after the bid-ask spread on 30-year on-the-run bonds, for instance, went from 1/32 on February 28 to more than 5/32s in mid-March to 2/32s by the end of March and lower since then. The price gap between on-the-run and off-the-run has moved back toward normal. The yield curve is down since mid-March by between 16 bp and 40 bp depending on maturity, and implied forward rates suggest limited movement for the next year or two. If there is opportunity in the Treasury curve, it’s in rising breakevens if the economy bounces more than expected later in the year.
The agency MBS market knows it can count on steady Fed support. Fed QE has brought the average option-adjusted spread on 30-year MBS down from a peak of 133 bp in mid-March to 54 bp lately, only a few basis points wide of the average of the last 20 years (Exhibit 1). The Fed has set a floor on MBS valuations.
Exhibit 1: MBS OAS has returned to the average of the last 20 years
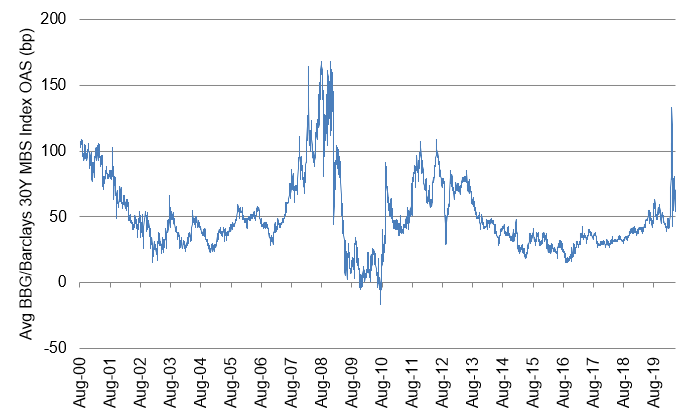
Source: Bloomberg, Amherst Pierpont Securities
MBS still has upside from a surge in forbearance offered to borrowers by Fannie Mae, Freddie Mac and Ginnie Mae. Forbearance should materially dampen prepayments in all agencies, improving convexity and value. The situation is still fluid, but at this point forbearance stands to reach 10% in Fannie Mae and Freddie Mac MBS and 20% in Ginnie Mae, with the FHA component of Ginnie Mae possibly reaching 30%. Elsewhere in this issue, my colleague Brian Landy estimates forbearance should add between 6/32s and 34/32s to the value of different TBA contracts, with the most value coming in Ginnie Mae’s higher coupons. Go overweight MBS.
Credit markets have also felt the impact of the Fed. Spreads on investment grade and high yield debt have tightened since mid-March to levels consistent with the 2001 recession and well below the 2008 recession (Exhibit 2). This has helped trigger record issuance in investment grade and high yield debt. The $300 billion in net investment grade issuance has already matched the annual numbers from 2018 and 2019. The $128 billion in net new high yield debt, helped by a heavy supply of fallen angels, has exceeded any full year since 2013. Although supply normally might limit potential for tighter spreads, in this market it signals a healthy build-up of cash for companies that will need it to weather economic uncertainty. Access to liquidity has made most of these issuers better credits on balance.
Exhibit 2: Corporate spreads have returned to recession levels
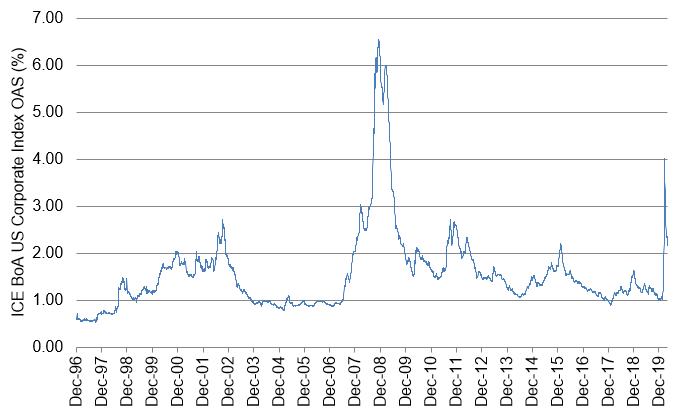
Note: The ICE BoA US Corporate Index referenced IG debt. Source: Federal Reserve, Amherst Pierpont Securities
All of the response in credit markets comes before the Fed has even fully deployed the different facilities intended to support corporate balance sheets. The Primary Market Corporate Credit Facility and the Secondary Market Corporate Credit Facility have not taken their first dollar of risk. At this point, it is not even clear the facilities will take substantial risk since the market has volunteered all the liquidity that borrowers want. Again the Fed has set a floor on corporate valuations.
The market is just starting to see the outlines of potentially the Fed’s most significant effort to support credit, the Main Street loan facilities. These facilities would make the Fed a direct lender to smaller but more highly leveraged companies. More than half of the $1.2 trillion in outstanding leveraged loans meet the leverage standards of the facilities although a range of questions remain around the Fed’s ability to scale up the program, existing lenders’ willingness to take on more debt and borrowers’ willingness to accept the Fed’s terms. These programs nevertheless are likely to help the stronger leveraged balance sheets in part by encouraging banks to ramp up the flow of their own debt capital to borrowers temporarily impaired by the economic effects of COVID-19. This sets a floor on risk for the most viable part of leveraged finance.
The base case for fixed income markets looks like low rates, a steeping yield curve and tightening spreads across all but the most leveraged categories of credit. That may not mesh with the tremendous uncertainty around the path of the economy over the next year. It clearly meshes with the path of a very certain Fed.
* * *
The view in rates
The current 0.61% rate on 10-year Treasury debt implies an average real rate of -45 bp and inflation of 106 bp. Implied inflation has run slightly above 100 bp since mid-March. Futures and OIS curves continue to imply policy rates near the zero-bound into 2023. QE along with other monetary and fiscal interventions of historic magnitude should keep concerns about inflation on the market agenda and keep the yield curve biased to steepen.
The view in spreads
Spreads markets with Fed or fiscal support should continue tightening, and the impact of scarcity, broad liquidity, falling default and prepayment premia should tighten other debt sectors, too. Those markets now include Treasury and agency MBS, agency CMBS and investment grade corporate debt, a wide range of ABS, legacy CMBS and ‘AAA’ static CLOs.
The view in credit
The immediate risk in credit is from companies with high fixed costs and a sharp drop in revenue from current efforts to avoid coronavirus infection. Rating agencies have started downgrading companies and related structured products, CLOs in particular, at a record pace. Companies with the highest leverage are first in line. Until the arrival of pandemic, the consumer balance sheet has been extremely strong. The coming sharp rise in unemployment should change that, although the CARES Act could help cushion the blow. Nevertheless, delinquencies and defaults on mortgage and consumer loans have already started to climb quickly.
This material is intended only for institutional investors and does not carry all of the independence and disclosure standards of retail debt research reports. In the preparation of this material, the author may have consulted or otherwise discussed the matters referenced herein with one or more of SCM’s trading desks, any of which may have accumulated or otherwise taken a position, long or short, in any of the financial instruments discussed in or related to this material. Further, SCM may act as a market maker or principal dealer and may have proprietary interests that differ or conflict with the recipient hereof, in connection with any financial instrument discussed in or related to this material.
This message, including any attachments or links contained herein, is subject to important disclaimers, conditions, and disclosures regarding Electronic Communications, which you can find at https://portfolio-strategy.apsec.com/sancap-disclaimers-and-disclosures.
Important Disclaimers
Copyright © 2026 Santander US Capital Markets LLC and its affiliates (“SCM”). All rights reserved. SCM is a member of FINRA and SIPC. This material is intended for limited distribution to institutions only and is not publicly available. Any unauthorized use or disclosure is prohibited.
In making this material available, SCM (i) is not providing any advice to the recipient, including, without limitation, any advice as to investment, legal, accounting, tax and financial matters, (ii) is not acting as an advisor or fiduciary in respect of the recipient, (iii) is not making any predictions or projections and (iv) intends that any recipient to which SCM has provided this material is an “institutional investor” (as defined under applicable law and regulation, including FINRA Rule 4512 and that this material will not be disseminated, in whole or part, to any third party by the recipient.
The author of this material is an economist, desk strategist or trader. In the preparation of this material, the author may have consulted or otherwise discussed the matters referenced herein with one or more of SCM’s trading desks, any of which may have accumulated or otherwise taken a position, long or short, in any of the financial instruments discussed in or related to this material. Further, SCM or any of its affiliates may act as a market maker or principal dealer and may have proprietary interests that differ or conflict with the recipient hereof, in connection with any financial instrument discussed in or related to this material.
This material (i) has been prepared for information purposes only and does not constitute a solicitation or an offer to buy or sell any securities, related investments or other financial instruments, (ii) is neither research, a “research report” as commonly understood under the securities laws and regulations promulgated thereunder nor the product of a research department, (iii) or parts thereof may have been obtained from various sources, the reliability of which has not been verified and cannot be guaranteed by SCM, (iv) should not be reproduced or disclosed to any other person, without SCM’s prior consent and (v) is not intended for distribution in any jurisdiction in which its distribution would be prohibited.
In connection with this material, SCM (i) makes no representation or warranties as to the appropriateness or reliance for use in any transaction or as to the permissibility or legality of any financial instrument in any jurisdiction, (ii) believes the information in this material to be reliable, has not independently verified such information and makes no representation, express or implied, with regard to the accuracy or completeness of such information, (iii) accepts no responsibility or liability as to any reliance placed, or investment decision made, on the basis of such information by the recipient and (iv) does not undertake, and disclaims any duty to undertake, to update or to revise the information contained in this material.
Unless otherwise stated, the views, opinions, forecasts, valuations, or estimates contained in this material are those solely of the author, as of the date of publication of this material, and are subject to change without notice. The recipient of this material should make an independent evaluation of this information and make such other investigations as the recipient considers necessary (including obtaining independent financial advice), before transacting in any financial market or instrument discussed in or related to this material.
Important disclaimers for clients in the EU and UK
This publication has been prepared by Trading Desk Strategists within the Sales and Trading functions of Santander US Capital Markets LLC (“SanCap”), the US registered broker-dealer of Santander Corporate & Investment Banking. This communication is distributed in the EEA by Banco Santander S.A., a credit institution registered in Spain and authorised and regulated by the Bank of Spain and the CNMV. Any EEA recipient of this communication that would like to affect any transaction in any security or issuer discussed herein should do so with Banco Santander S.A. or any of its affiliates (together “Santander”). This communication has been distributed in the UK by Banco Santander, S.A.’s London branch, authorised by the Bank of Spain and subject to regulatory oversight on certain matters by the Financial Conduct Authority (FCA) and the Prudential Regulation Authority (PRA).
The publication is intended for exclusive use for Professional Clients and Eligible Counterparties as defined by MiFID II and is not intended for use by retail customers or for any persons or entities in any jurisdictions or country where such distribution or use would be contrary to local law or regulation.
This material is not a product of Santander´s Research Team and does not constitute independent investment research. This is a marketing communication and may contain ¨investment recommendations¨ as defined by the Market Abuse Regulation 596/2014 ("MAR"). This publication has not been prepared in accordance with legal requirements designed to promote the independence of research and is not subject to any prohibition on dealing ahead of the dissemination of investment research. The author, date and time of the production of this publication are as indicated herein.
This publication does not constitute investment advice and may not be relied upon to form an investment decision, nor should it be construed as any offer to sell or issue or invitation to purchase, acquire or subscribe for any instruments referred herein. The publication has been prepared in good faith and based on information Santander considers reliable as of the date of publication, but Santander does not guarantee or represent, express or implied, that such information is accurate or complete. All estimates, forecasts and opinions are current as at the date of this publication and are subject to change without notice. Unless otherwise indicated, Santander does not intend to update this publication. The views and commentary in this publication may not be objective or independent of the interests of the Trading and Sales functions of Santander, who may be active participants in the markets, investments or strategies referred to herein and/or may receive compensation from investment banking and non-investment banking services from entities mentioned herein. Santander may trade as principal, make a market or hold positions in instruments (or related derivatives) and/or hold financial interest in entities discussed herein. Santander may provide market commentary or trading strategies to other clients or engage in transactions which may differ from views expressed herein. Santander may have acted upon the contents of this publication prior to you having received it.
This publication is intended for the exclusive use of the recipient and must not be reproduced, redistributed or transmitted, in whole or in part, without Santander’s consent. The recipient agrees to keep confidential at all times information contained herein.


