Uncategorized
Balancing price upside and downside in CRT
admin | April 17, 2020
This material is a Marketing Communication and does not constitute Independent Investment Research.
The market in credit risk transfers has gone on a roller coaster ride since mid-February with big ups and downs in prices and changes in the outlook for residential credit. Investors can still get a handle on relative value by framing a base case, a bullish case and a bearish case for CRT. By looking at plausible security prices in those instances, a clear picture emerges of securities that have much more upside than downside. Seasoned CRT that absorbs actual rather than fixed losses comes out looking the best.
Prices on the longest and last cash flows of CRT have rallied meaningfully in recent weeks, but the universe of those bonds still trades below par. These discount dollar price likely reflect changes to both financing and fundamentals. As available financing for the asset class has dried up, investors have likely required more spread compensation to meet their unlevered return bogeys. Discount dollar prices also certainly reflect uncertainty and new fundamental risks from the continued effects of COVID-19 on the economy. While it’s impossible to peg what virus-related delinquency and default rates will be, reasonable assumptions can frame baseline, bullish and bearish possibilities. And looking at the relative performance of these bonds to those scenarios may serve as a reasonable way to frame relative value.
Pricing base case, bullish and bearish possibilities
One thing we can say with certainty is that COVID-19 is already having an impact on borrower performance. Business disruption and loss of income has driven affected borrowers to reach for payment forbearance offered by the enterprises, which will, in turn, drive delinquency rates higher on these deals. And some of those loans will in all likelihood roll to default. In addition to delinquencies and defaults, the effects of the virus could put downward pressure on regional or national home prices. Other factors also will influence fundamental performance in CRT including prepayment rates, incidence and type of permanent modification and a handful of others. These three can be used to begin to construct base, bullish and bearish scenarios
Given the current velocity of applications for forbearance from GSE borrowers, the base case analysis assumes a monthly 3% rise in delinquency rates for the next six months. It also assumes implied forward interest rates and corresponding prepayments. From there, current market prices correspond to a spread for each bond, and this analysis can use that spread to solve for a price in scenarios that assume bullish lower delinquency rates or bearish higher delinquency rates coupled with a decline in home prices to the downside.
The pricing in base, bullish and bearish scenarios helps produce a pair of important measures: the percentage price gain in the bullish case, and the percentage price loss in the bearish case. For example, the price of a CRT might rise by 3% in the bullish case and drop by 1% in the bearish case. That security would have an upside-to-downside ratio of 3-to-1, or 300%. That would look more attractive than a second security that might have 2% upside and 1% downside, or a ratio of 200%.
Exhibit 1: Evaluating price convexity across CRT LCF
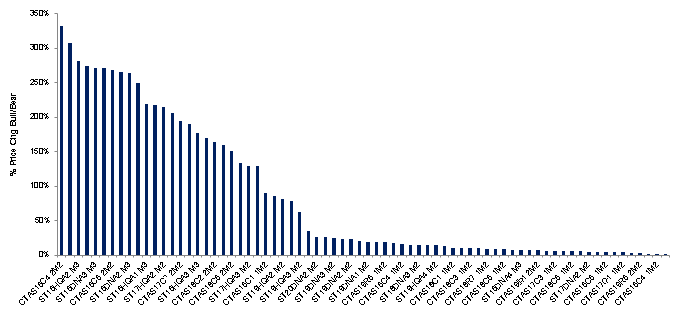
Note: Pricing and curve as of COB 4/14/20 Analysis solves for a Discount Margin assuming a monthly 3% increase in delinquency rates and a 50% roll-to-default along a single base case assumption for both prepayments and HPA. Each bond’s DM is then used to solve for a price in the ‘bull’ case which assumes 1% DQ per month for six months with a 50% roll-to-default with no change to HPA assumptions and a ‘bear’ case where delinquencies spike to 4.5% per month for six months concurrent with an immediate 10% downward shock in home prices. Price convexity is calculated as [(% price change bull)/(% price change bear)] -1. Deals that solved for a negative discount margin under the base line stress were excluded from the analysis. Source: Vista, Amherst Pierpont Securities
Using this approach, seasoned actual-loss deals fare better than others for a few reasons (Exhibit 1). First, 2015 through 2017 vintages have deleveraged fairly substantially from the perspective of both the borrower and the structure. The steady rise in HPA since issuance has built substantial borrower equity, which should protect bond holders from losses against the backdrop of moderate home price stresses. Both high- and low-LTV seasoned deals appear to offer better price performance relative to other cohorts. In fact, seasoned high LTV last cash flows like the M3 classes of 2015 vintage STACR HQA deals offer some of the most attractive relative price performance. Additionally, certain 2018 vintage CAS high LTV deals appear to offer attractive relative price performance likely driven by lower loss severities as a function of deep MI coverage coupled with some seasoning and deleveraging. By contrast, newer vintage actual loss deals and earlier vintage fixed severity deals fare worse under this framework. The market seems to be relatively enamored with higher WAC 2019 last cash flows based on the view that they will continue to prepay faster than other cohorts. However, a steady increase in payment forbearance, frictions to refinancing from shelter-in-place orders and the tightening of credit overlays against the backdrop of an economic downturn all could materially suppress prepayment rates leaving these deals exposed to more fundamental tail risk than investors might otherwise anticipate. Fixed severity deal also fare poorly under this methodology as seriously delinquent loans will become credit events after they are more than 180 days delinquent. At that point, loans get removed from the pool with a fixed severity that will increase based on the number of total credit events. Some fixed severity deals traded to a negative discount margin to the base case delinquency scenario and were not run to the bullish and bearish scenarios. As it stands, loans in forbearance will be treated as delinquent for the purposes of calculating credit events in fixed severity deals and delinquency trigger calculations in all CRT. And while investors have petitioned for those loans to get the same treatment that they would get in the case of a natural disaster, FHFA has remained silent on any potential resolution to date.
With the caveat that assuming ‘bull’ and ‘bear’ cases may in reality not be equally likely, relative price performance can help frame relative value across the universe of CRT last cash flows. While dollar prices remain somewhat depressed on these assets, a majority of that may just reflect new fundamental risks to the asset class. Setting a new normal and evaluating relative price performance in better or worse scenarios should help re-frame the CRT market.
This material is intended only for institutional investors and does not carry all of the independence and disclosure standards of retail debt research reports. In the preparation of this material, the author may have consulted or otherwise discussed the matters referenced herein with one or more of SCM’s trading desks, any of which may have accumulated or otherwise taken a position, long or short, in any of the financial instruments discussed in or related to this material. Further, SCM may act as a market maker or principal dealer and may have proprietary interests that differ or conflict with the recipient hereof, in connection with any financial instrument discussed in or related to this material.
This message, including any attachments or links contained herein, is subject to important disclaimers, conditions, and disclosures regarding Electronic Communications, which you can find at https://portfolio-strategy.apsec.com/sancap-disclaimers-and-disclosures.
Important Disclaimers
Copyright © 2026 Santander US Capital Markets LLC and its affiliates (“SCM”). All rights reserved. SCM is a member of FINRA and SIPC. This material is intended for limited distribution to institutions only and is not publicly available. Any unauthorized use or disclosure is prohibited.
In making this material available, SCM (i) is not providing any advice to the recipient, including, without limitation, any advice as to investment, legal, accounting, tax and financial matters, (ii) is not acting as an advisor or fiduciary in respect of the recipient, (iii) is not making any predictions or projections and (iv) intends that any recipient to which SCM has provided this material is an “institutional investor” (as defined under applicable law and regulation, including FINRA Rule 4512 and that this material will not be disseminated, in whole or part, to any third party by the recipient.
The author of this material is an economist, desk strategist or trader. In the preparation of this material, the author may have consulted or otherwise discussed the matters referenced herein with one or more of SCM’s trading desks, any of which may have accumulated or otherwise taken a position, long or short, in any of the financial instruments discussed in or related to this material. Further, SCM or any of its affiliates may act as a market maker or principal dealer and may have proprietary interests that differ or conflict with the recipient hereof, in connection with any financial instrument discussed in or related to this material.
This material (i) has been prepared for information purposes only and does not constitute a solicitation or an offer to buy or sell any securities, related investments or other financial instruments, (ii) is neither research, a “research report” as commonly understood under the securities laws and regulations promulgated thereunder nor the product of a research department, (iii) or parts thereof may have been obtained from various sources, the reliability of which has not been verified and cannot be guaranteed by SCM, (iv) should not be reproduced or disclosed to any other person, without SCM’s prior consent and (v) is not intended for distribution in any jurisdiction in which its distribution would be prohibited.
In connection with this material, SCM (i) makes no representation or warranties as to the appropriateness or reliance for use in any transaction or as to the permissibility or legality of any financial instrument in any jurisdiction, (ii) believes the information in this material to be reliable, has not independently verified such information and makes no representation, express or implied, with regard to the accuracy or completeness of such information, (iii) accepts no responsibility or liability as to any reliance placed, or investment decision made, on the basis of such information by the recipient and (iv) does not undertake, and disclaims any duty to undertake, to update or to revise the information contained in this material.
Unless otherwise stated, the views, opinions, forecasts, valuations, or estimates contained in this material are those solely of the author, as of the date of publication of this material, and are subject to change without notice. The recipient of this material should make an independent evaluation of this information and make such other investigations as the recipient considers necessary (including obtaining independent financial advice), before transacting in any financial market or instrument discussed in or related to this material.
Important disclaimers for clients in the EU and UK
This publication has been prepared by Trading Desk Strategists within the Sales and Trading functions of Santander US Capital Markets LLC (“SanCap”), the US registered broker-dealer of Santander Corporate & Investment Banking. This communication is distributed in the EEA by Banco Santander S.A., a credit institution registered in Spain and authorised and regulated by the Bank of Spain and the CNMV. Any EEA recipient of this communication that would like to affect any transaction in any security or issuer discussed herein should do so with Banco Santander S.A. or any of its affiliates (together “Santander”). This communication has been distributed in the UK by Banco Santander, S.A.’s London branch, authorised by the Bank of Spain and subject to regulatory oversight on certain matters by the Financial Conduct Authority (FCA) and the Prudential Regulation Authority (PRA).
The publication is intended for exclusive use for Professional Clients and Eligible Counterparties as defined by MiFID II and is not intended for use by retail customers or for any persons or entities in any jurisdictions or country where such distribution or use would be contrary to local law or regulation.
This material is not a product of Santander´s Research Team and does not constitute independent investment research. This is a marketing communication and may contain ¨investment recommendations¨ as defined by the Market Abuse Regulation 596/2014 ("MAR"). This publication has not been prepared in accordance with legal requirements designed to promote the independence of research and is not subject to any prohibition on dealing ahead of the dissemination of investment research. The author, date and time of the production of this publication are as indicated herein.
This publication does not constitute investment advice and may not be relied upon to form an investment decision, nor should it be construed as any offer to sell or issue or invitation to purchase, acquire or subscribe for any instruments referred herein. The publication has been prepared in good faith and based on information Santander considers reliable as of the date of publication, but Santander does not guarantee or represent, express or implied, that such information is accurate or complete. All estimates, forecasts and opinions are current as at the date of this publication and are subject to change without notice. Unless otherwise indicated, Santander does not intend to update this publication. The views and commentary in this publication may not be objective or independent of the interests of the Trading and Sales functions of Santander, who may be active participants in the markets, investments or strategies referred to herein and/or may receive compensation from investment banking and non-investment banking services from entities mentioned herein. Santander may trade as principal, make a market or hold positions in instruments (or related derivatives) and/or hold financial interest in entities discussed herein. Santander may provide market commentary or trading strategies to other clients or engage in transactions which may differ from views expressed herein. Santander may have acted upon the contents of this publication prior to you having received it.
This publication is intended for the exclusive use of the recipient and must not be reproduced, redistributed or transmitted, in whole or in part, without Santander’s consent. The recipient agrees to keep confidential at all times information contained herein.


