


Uncategorized
The full force of the Fed flows into the markets
admin | April 3, 2020
This material is a Marketing Communication and does not constitute Independent Investment Research.
In the most rapid response to crisis in modern financial history, the Fed in a few short weeks has unleashed almost every major tool in its kit for shaping markets. The tools, so far, have worked. Low fed funds and unprecedented QE have pulled down rates, raised inflation expectations and tightened spreads across a wide range of assets. The Fed’s Main Street Business Lending Program should start to roll out in the coming weeks, adding another $4.5 trillion in potential lending. Riskier cash flows should get a lift from the Fed’s efforts with the most fundamentally sound cash flows trading toward historically aggressive levels.
Fast and expansive Fed monetary and regulatory intervention
The Fed in March alone covered ground that took it years in the aftermath of the 2008 financial crisis (Exhibit 1). It lowered fed funds sharply, launched QE, started programs to support commercial paper, primary dealer balance sheets, and money market mutual funds and started funneling dollars to foreign borrowers. The Fed’s biggest day came on March 23 when it lifted explicit limits on buying MBS, started unprecedented programs to buy investment grade corporate debt and agency CMBS, and launched a program to lend against a range of ABS.
Exhibit 1: Fed monetary policy actions since March 1
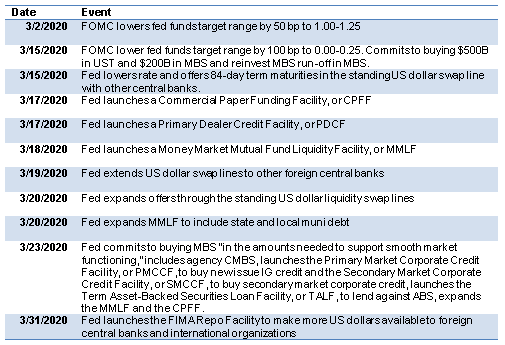
Source: Federal Reserve, Amherst Pierpont Securities
The Fed and bank regulators at the same time quickly relaxed rules that might limit banks’ ability to support markets and lending (Exhibit 2). On March 27, for example, regulators allowed a 2-year extension for implementing rules on current expected credit losses, or CECL, which require banks to reserve at time of origination against all losses expected over the life of a loan. That rule could have tied up capital. On April 1, the Fed allowed banks to exclude Treasury debt and excess reserves from calculations of a key capital ratio, making it easier for the largest banks to buy Treasury debt and build excess reserves. Last September’s spike in overnight repo rates unveiled the potential for bank regulations to limit the flow of cash across the financial system, and regulators seem focused on making sure regulation does not impede current efforts.
Exhibit 2: Fed regulatory actions related to coronavirus since March 1
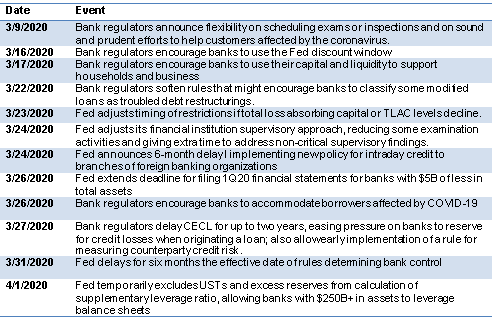
Source: Federal Reserve, Amherst Pierpont Securities
Results right out of the crisis playbook
The Fed’s efforts so far have produced market results right out of the crisis playbook.
Lower rates
QE after the 2008 crisis tended to drive down rates across the Treasury curve, and rates have dropped again with the latest round of Fed buying. As the Fed has absorbed $955 billion in Treasury debt and $345 billion in agency MBS, rates on 10-year Treasury notes have dropped from 1.00% or higher in the middle of March towards 0.60% at the end (Exhibit 3). By taking Treasury debt out of the market, QE forces portfolios that still need the debt to pay a higher price. QE also signals Fed intentions to keep rates low for longer than traditional monetary policy might imply. Not only does the Fed hold more debt subject to losses at higher rates, but its recent regulatory efforts to make it easier for banks to hold Treasury debt encourages banks to raise their stake, too.
Exhibit 3: The launch of new QE has coincided with a drop in Treasury rates
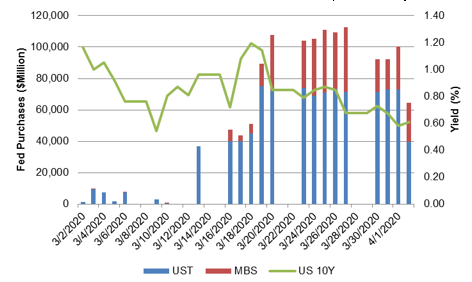
Note: data from March 1 to April 2, 2020. Source: Federal Reserve, Bloomberg, Amherst Pierpont Securities.
Higher implied inflation
Past QE has also driven up market expectations for inflation, and that has happened again since mid-March. Inflation implied by the spread between 10-year Treasury notes and TIPS has run from near 60 bp in the middle of March to nearly 100 bp at the end (Exhibit 4). QE historically has started in markets uncertain about its ultimate impact, including its impact on inflation. The speed and magnitude of Fed intervention this time around increases the tail risk that the economy could come back at some point with productive capacity at or below earlier levels but with a lot more dollars chasing the goods. Earlier rounds of QE had little effect on realized inflation since much of the money sat on bank balance sheets and never made it into the real economy. This time, the Fed’s TALF and Main Street Business Lending programs will lend directly to US businesses and consumers. Concern about inflation should continue, and the yield curve should steepen steadily.
Exhibit 4: QE has coincided with a rise in breakeven inflation
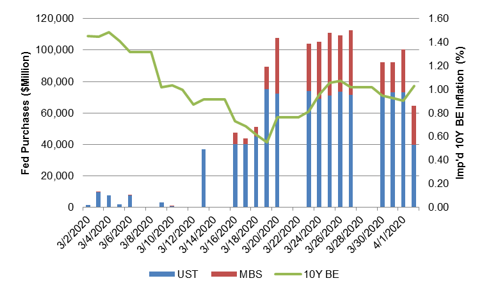
Note: data from March 1 to April 2, 2020, showing the difference between yields on US 10-year notes and TIPS. Source: Federal Reserve, Bloomberg, Amherst Pierpont Securities.
Tighter spreads especially in stronger products
Past QE also drove spreads in agency debt and MBS tighter and pulled investment grade credit along, and the pattern has repeated itself so far. Spreads on agency MBS continued to widen after the Fed’s initial March 15 commitment to buy $200 billion in MBS as REITs continued heavy selling of agency pools. But once the Fed’s commitment effectively became unlimited on March 23, nominal MBS spreads tightened within five days from nearly 140 bp to around 90 bp (Exhibit 5). Spreads have since varied depending on the size of daily Fed interventions. Spreads on investment grade corporate debt widened until the Fed on March 23 also announced programs to buy new issue and secondary debt. This unprecedented decision now makes the Fed a direct lender to US business through the capital markets. Spreads on agency CMBS also widened until the Fed on March 23 added that sector to the QE mix.
Just as it does in Treasury debt, QE makes the supply of risk exposure to prepayments and investment grade credit scarce, and portfolios that need that exposure have to pay a higher price. The Fed has bought little corporate credit so far, although the willingness to buy has given a backstop to the market and encouraged capital to flow into investment grade. If the Fed continues to build its share of those markets or backstop them, spreads should remain tight or go tighter.
Exhibit 5: QE has coincided with tighter spreads in agency MBS and IG credit
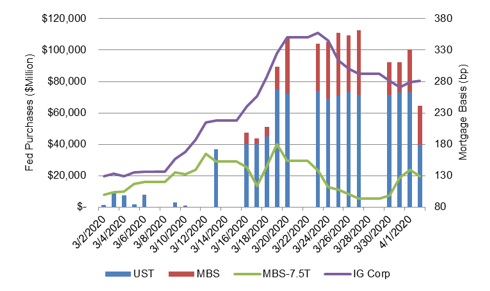
Note: data from March 1 to April 2, 2020, showing the difference between par 30-year MBS and the average of 5- and 10-year Treasury yields and showing the par-weighted OAS on cash corporate debt. Source: Federal Reserve, Bloomberg, Amherst Pierpont Securities.
Main Street Business Lending Program still to come
The Fed’s Main Street Business Lending Program promises to be the biggest of all. The CARES Act gave the Treasury’s Exchange Stabilization Fund $450 billion to use in conjunction with the Fed. The ESF will use the money to put a layer of equity in one or more Fed special purpose vehicles. The equity satisfies a legal requirement to protect the Fed from loss. But the Fed, against every $1 of equity, historically has made $10 in loans out of its SPVs, potentially creating $4.5 trillion in lending for this crisis. And the mandate is to lend to US business without adequate funding available elsewhere.
The extraordinary thing about the Main Street program is the Fed’s effort to lend directly to a wider set of businesses than those able to issue investment grade debt. The rules for the program should come out in early April. Besides conventional businesses, it’s conceivable that a broad definition could include securitization trusts, loan funds, debt funds and other financial operations.
No matter the definition, the program puts the Fed in a business traditionally reserved for banks. The Fed no longer is just a lender of last resort to banks and the capital markets; it is about to become a lender of last resort to Main Street and should have effects similar to those seen in capital markets. The supply of lending opportunities available to banks and others should narrow and terms and spreads on the remaining supply should improve.
And just as the Fed has, for practical purposes, become a permanent force in the capital markets generally and in Treasury debt, agency debt and MBS, investment grade corporate debt and ABS specifically, it is likely to become a permanent force in bank lending. Getting into a market has proven far easier for the Fed than getting out.
Investment implications
The size and speed of Fed support for the markets should keep rates low and take spreads in agency MBS and investment grade credit steadily tighter. Depending on the scope of the Main Street program, spreads in other assets should get direct support and go steadily tighter, too.
There is risk, of course. Getting out of this intervention as the economy reengages looks likely to be fraught with concerns about inflation, steeping the yield curve. And the path of the economy from here still is highly uncertain. There are plausible scenarios where secondary occurrences of COVID-19, limited testing and lack of a vaccine could keep economic activity suppressed. That would keep the economy off balance far longer than the few months that current monetary and fiscal policy envision. The Fed and the broader government would need to step up again. The fundamental quality of credit and productive capacity could erode. That would put us further into uncharted territory.
* * *
The view in rates
The current 0.59% rate on 10-year Treasury debt implies an average real rate of -49 bp and inflation of 108 bp. Futures now imply policy rates at zero-bound into early 2022. Guidelines for the Main Street Business Lending Program should come out shortly, with potentially significant implications for the level of rates and the shape of the yield curve
The view in spreads
Spreads markets with Fed or fiscal support should continue tightening, and impact of scarcity, broad liquidity, falling default and prepayment premia should tighten other debt sectors, too. As liquidity pressure ebbs, relative value should quickly become more important.
The view in credit
The immediate risk in credit is from companies with high fixed costs and a sharp drop in revenue from current efforts to avoid coronavirus infection. Companies with the highest leverage are first in line. Potential downgrades and defaults among leveraged lends should ramp up quickly. Until the arrival of pandemic, the consumer balance sheet has been extremely strong. The coming sharp rise in unemployment should change that, although the CARES Act could substantially cushion the blow.