Uncategorized
Mapping tenant risk into multifamily loans
admin | April 3, 2020
This material is a Marketing Communication and does not constitute Independent Investment Research.
One month into the pandemic two things are clear: the economic ramifications vary greatly based on the industry and its location; and renters who are employed in those hard-hit industries and areas are likely to be more vulnerable to financial setbacks than homeowners. A heat map is utilized for multifamily CMBS to score the proximity of underlying properties to the most troubled areas and help assess relative risk across deals.
There are 122 million households in the US, where 44 million or 36% of those are renters and 78 million or 64% are owners. As a group, renters tend to have less education and lower incomes than homeowners. Only 26% of renters have a bachelor’s degree or higher compared to 39% of owners. Renters have a significantly lower median income than homeowners, $36,100 for renters in 2017 compared to $70,000 for owners, and the distribution of income for renters tends to be skewed lower than the distribution for homeowners (Exhibit 1).
Exhibit 1: Household income of renters vs owners
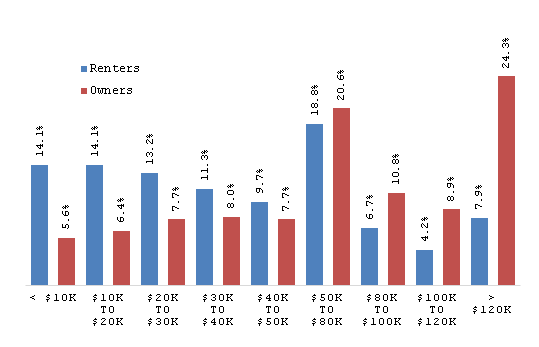
Source: American Housing Survey 2017, US Census Bureau, Amherst Pierpont Securities
As a group renters are more vulnerable than owners to potential job loss and financial strains from COVID-19. A greater proportion of renters tend to work in hourly wage jobs and in the hard-hit hospitality, transportation and service industries. As shutdowns have spread across the country, retail, construction and trades have also come under enormous pressure from layoffs and are likely disproportionately affecting renters.
Mapping where help is needed most
The federal government and the GSEs have begun forbearance programs for multifamily borrowers that include protection from eviction for tenants. Coupled with the expansion of unemployment benefits, sick leave and cash payments under the CARES Act, these measures should alleviate some of the pressure on both renters and owners. However, it’s unlikely that renter households in particular will be capable of fully catching up on back rent after forbearance ends.
Analysts at Amherst Holdings led by Sandeep Bordia evaluated areas across the country with employment concentrated in those industries hardest hit by COVID-19. They calculated the amount of rental payment support that is likely to be needed, broken down by Congressional district, in Coronavirus: Don’t forget America’s 43.8 million renters. The projected amount of additional rental payment support varied from a low of $6 million in a modestly impacted district in New Mexico, to a high of $54 million in one of the Congressional districts of New York. The districts that are projected to need the greatest amount of support for renters are located in states with currently the largest numbers of cases, including New York, California and New Jersey.
Congressional districts have roughly equal populations by design, currently about 750,000 residents in each district, though their demographic and economic composition obviously varies widely. The amount of projected support required for multifamily renters in each district can serve as a heat map of potential difficulty faced by multifamily borrowers in those areas as well. Based on the base case calculations of additional support from $6 million to $54 million the heat map has scoring from 1 to 48, with 1 being the lowest score (green) and 48 being the highest score (red).
Scoring COVID-19 exposure in agency CMBS
Freddie K-deals tend to be geographically diverse and benefit from low average loan size (Exhibit 2). Although the deals could not have been designed to lower multifamily risk from a pandemic, those two characteristics help mitigate risk. Heat scores range from 1 to 48, but most Freddie K-deals have weighted average scores in the mid- to low-teens. Deals with heavy defeasance but a few concentrated loan exposures in hard-hit areas need monitoring, because the extension of forbearance to multifamily borrowers is likely to increase loss severities for loans that do eventually default.
Exhibit 2: Heat map scoring for FREMF 2019-K43
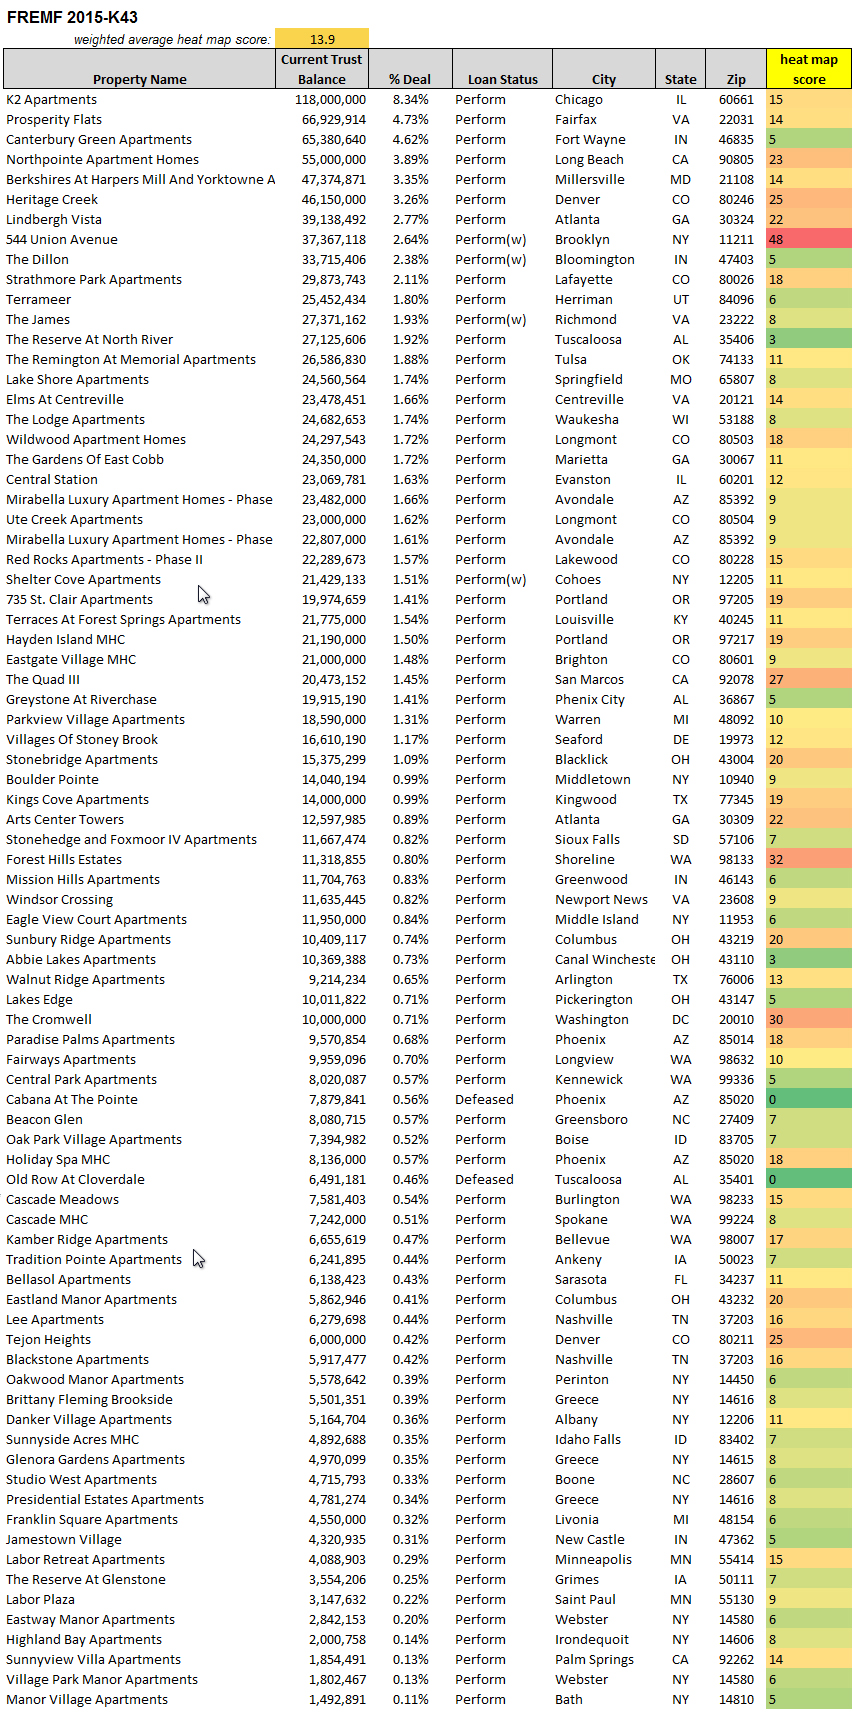
Source: Freddie Mac, Amherst Holdings, Amherst Pierpont Securities
Deals with heavy defeasance but a few concentrated loan exposures in hard hit areas need monitoring, because the extension of forbearance to multifamily borrowers is likely to increase loss severities for loans that do eventually default.
Exhibit 3: Heat map scores for a sampling of Freddie K-deals
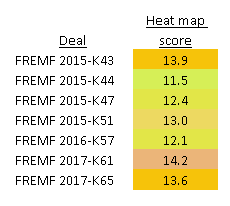
Source: Freddie Mac, Amherst Holdings, Amherst Pierpont Securities
This analysis has been extended to include all Freddie K-deals, Ginnie Mae project loans and Fannie Mae DUS pools and GeMS. Complete results available upon request.
This material is intended only for institutional investors and does not carry all of the independence and disclosure standards of retail debt research reports. In the preparation of this material, the author may have consulted or otherwise discussed the matters referenced herein with one or more of SCM’s trading desks, any of which may have accumulated or otherwise taken a position, long or short, in any of the financial instruments discussed in or related to this material. Further, SCM may act as a market maker or principal dealer and may have proprietary interests that differ or conflict with the recipient hereof, in connection with any financial instrument discussed in or related to this material.
This message, including any attachments or links contained herein, is subject to important disclaimers, conditions, and disclosures regarding Electronic Communications, which you can find at https://portfolio-strategy.apsec.com/sancap-disclaimers-and-disclosures.
Important Disclaimers
Copyright © 2026 Santander US Capital Markets LLC and its affiliates (“SCM”). All rights reserved. SCM is a member of FINRA and SIPC. This material is intended for limited distribution to institutions only and is not publicly available. Any unauthorized use or disclosure is prohibited.
In making this material available, SCM (i) is not providing any advice to the recipient, including, without limitation, any advice as to investment, legal, accounting, tax and financial matters, (ii) is not acting as an advisor or fiduciary in respect of the recipient, (iii) is not making any predictions or projections and (iv) intends that any recipient to which SCM has provided this material is an “institutional investor” (as defined under applicable law and regulation, including FINRA Rule 4512 and that this material will not be disseminated, in whole or part, to any third party by the recipient.
The author of this material is an economist, desk strategist or trader. In the preparation of this material, the author may have consulted or otherwise discussed the matters referenced herein with one or more of SCM’s trading desks, any of which may have accumulated or otherwise taken a position, long or short, in any of the financial instruments discussed in or related to this material. Further, SCM or any of its affiliates may act as a market maker or principal dealer and may have proprietary interests that differ or conflict with the recipient hereof, in connection with any financial instrument discussed in or related to this material.
This material (i) has been prepared for information purposes only and does not constitute a solicitation or an offer to buy or sell any securities, related investments or other financial instruments, (ii) is neither research, a “research report” as commonly understood under the securities laws and regulations promulgated thereunder nor the product of a research department, (iii) or parts thereof may have been obtained from various sources, the reliability of which has not been verified and cannot be guaranteed by SCM, (iv) should not be reproduced or disclosed to any other person, without SCM’s prior consent and (v) is not intended for distribution in any jurisdiction in which its distribution would be prohibited.
In connection with this material, SCM (i) makes no representation or warranties as to the appropriateness or reliance for use in any transaction or as to the permissibility or legality of any financial instrument in any jurisdiction, (ii) believes the information in this material to be reliable, has not independently verified such information and makes no representation, express or implied, with regard to the accuracy or completeness of such information, (iii) accepts no responsibility or liability as to any reliance placed, or investment decision made, on the basis of such information by the recipient and (iv) does not undertake, and disclaims any duty to undertake, to update or to revise the information contained in this material.
Unless otherwise stated, the views, opinions, forecasts, valuations, or estimates contained in this material are those solely of the author, as of the date of publication of this material, and are subject to change without notice. The recipient of this material should make an independent evaluation of this information and make such other investigations as the recipient considers necessary (including obtaining independent financial advice), before transacting in any financial market or instrument discussed in or related to this material.
Important disclaimers for clients in the EU and UK
This publication has been prepared by Trading Desk Strategists within the Sales and Trading functions of Santander US Capital Markets LLC (“SanCap”), the US registered broker-dealer of Santander Corporate & Investment Banking. This communication is distributed in the EEA by Banco Santander S.A., a credit institution registered in Spain and authorised and regulated by the Bank of Spain and the CNMV. Any EEA recipient of this communication that would like to affect any transaction in any security or issuer discussed herein should do so with Banco Santander S.A. or any of its affiliates (together “Santander”). This communication has been distributed in the UK by Banco Santander, S.A.’s London branch, authorised by the Bank of Spain and subject to regulatory oversight on certain matters by the Financial Conduct Authority (FCA) and the Prudential Regulation Authority (PRA).
The publication is intended for exclusive use for Professional Clients and Eligible Counterparties as defined by MiFID II and is not intended for use by retail customers or for any persons or entities in any jurisdictions or country where such distribution or use would be contrary to local law or regulation.
This material is not a product of Santander´s Research Team and does not constitute independent investment research. This is a marketing communication and may contain ¨investment recommendations¨ as defined by the Market Abuse Regulation 596/2014 ("MAR"). This publication has not been prepared in accordance with legal requirements designed to promote the independence of research and is not subject to any prohibition on dealing ahead of the dissemination of investment research. The author, date and time of the production of this publication are as indicated herein.
This publication does not constitute investment advice and may not be relied upon to form an investment decision, nor should it be construed as any offer to sell or issue or invitation to purchase, acquire or subscribe for any instruments referred herein. The publication has been prepared in good faith and based on information Santander considers reliable as of the date of publication, but Santander does not guarantee or represent, express or implied, that such information is accurate or complete. All estimates, forecasts and opinions are current as at the date of this publication and are subject to change without notice. Unless otherwise indicated, Santander does not intend to update this publication. The views and commentary in this publication may not be objective or independent of the interests of the Trading and Sales functions of Santander, who may be active participants in the markets, investments or strategies referred to herein and/or may receive compensation from investment banking and non-investment banking services from entities mentioned herein. Santander may trade as principal, make a market or hold positions in instruments (or related derivatives) and/or hold financial interest in entities discussed herein. Santander may provide market commentary or trading strategies to other clients or engage in transactions which may differ from views expressed herein. Santander may have acted upon the contents of this publication prior to you having received it.
This publication is intended for the exclusive use of the recipient and must not be reproduced, redistributed or transmitted, in whole or in part, without Santander’s consent. The recipient agrees to keep confidential at all times information contained herein.


