Uncategorized
Loan values plunge, leveraged borrowers reach for cash
admin | March 20, 2020
This material is a Marketing Communication and does not constitute Independent Investment Research.
The leveraged loan market continues to plunge as large parts of the US economy shut down to contain the coronavirus. An expected sharp drop in revenues has triggered a surge in draws on revolving lines of credit by leveraged companies, improving chances of survival but reducing potential recovery rates. And as loan prices plunge, many CLOs now show portfolio values too low to cover even their ‘BBB’ classes. But ‘AAA’ classes still look like fundamentally sound cash flows at wide spreads.
Loan prices go into a tailspin
The risk of downgrade and default has sent loan prices into a tailspin. The price of the average loan in the S&P/LSTA Leveraged Loan Index since the start of March has dropped from $95.18 to $78.40, nearly an 18% drop (Exhibit 1). But the average loan in the more liquid S&P/LSTA 100 Index has dropped from $95.90 to $77.06, a 20% drop. The sharper drop in more liquid assets signals a sudden and strong investor preference for cash.
Exhibit 1: Loan prices have quickly dropped below the 2014-2016 energy crisis
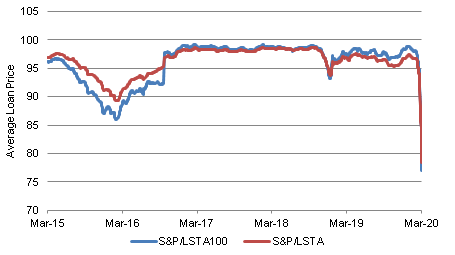
Source: Bloomberg, Amherst Pierpont Securities
The quick plunge in average loan prices below $80 raises the potential for even sharper drops in price. CLOs buying loans below $80 usually have to carry the loans at purchase price instead of par for the purpose of CLOs’ par overcollateralization tests. Deals that fail those tests could see cash diverted from equity and lower classes to more senior classes. With CLOs still the largest marginal buyer of loans, an air pocket in demand for loans below $80 likely makes these loans more volatile.
Overall loan pricing likely reflects investor expectations of months of sharply lower borrower revenues with a range of issuers having limited room to maneuver. Corporations with more than $50 million in earnings taking out leveraged loans in 2018 and 2019 had an average ratio of EBITDA-to-cash-interest of around 3.5x. A sudden and sharp drop in earnings would threaten the ability of many borrowers to cover debt payments.
Borrowers reach for their lines of credit
Borrowers themselves show signs of preparing for a cash shortfall. Issuers of leverage loans have publicly disclosed in March nearly $54 billion in draws on lines of credit, with more than three-fourths drawn since March 16 (Exhibit 2).
Exhibit 2: Leveraged companies have started tapping lines of credit
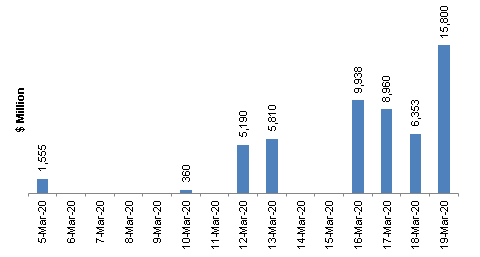
Note: new draws on lines of credit by SEC-registered borrowers in the leverage loan market. Source: S&P Global Intelligence, Amherst Pierpont Securities
Drawing on a line of credit can have mixed results for the CLOs that invest in the borrower’s institutional term loan. Even though most term loans in recent years have come with limited covenants, the associated revolving lines commonly come with traditional covenants controlled by the originating banks. Drawing down a line brings these covenants into play, allowing the banks to discipline the borrower’s finances while putting cash on the balance sheet. But revolving lines often are senior to the institutional term loan. So while a drawn line improves the chances for the borrower to weather a cash crunch, it lowers potential recovery for the institutional loan investors if the company fails.
Market value coverage for median ‘BBB’ and lower classes falls short
The plunge in loan prices has left the market value of many CLO portfolios well below levels needed to repay all debt if the portfolio were liquidated immediately. Market value overcollateralization below 100% indicates a shortfall in ability to pay a class of debt and all classes senior to it. The median MVOC of outstanding ‘BBB’ classes started March near 110% and has dropped to 98% (Exhibit 3). The median ‘BB’ has dropped from 104% to 93%. And the median ‘B’ has dropped from 101.5% to 90.8%.
Exhibit 3: Median MVOC for ‘BBB’ classes and below has dropped below 100%
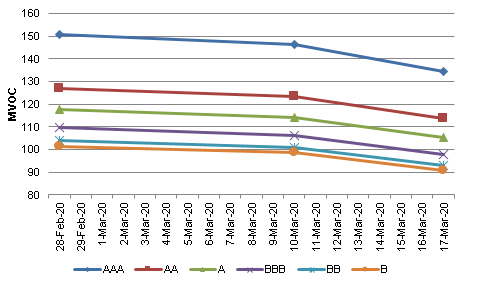
Source: Bloomberg, Amherst Pierpont Securities
The median MVOC for ‘A’ and higher rated classes has also dropped in March but remains above 100%.
Lower MVOCs across CLO classes and heavy demand for liquidity has widened CLO spreads sharply. Spreads on ‘BB’ and ‘BBB’ classes still remain below levels seen in the 2014-2016 energy crunch (Exhibit 4). But spreads on ‘A’ and higher classes have widened beyond the levels of the 2014-2016 energy crunch. As in the loan market, this signals sharpening investor preference for cash. CLO portfolios seem to be selling their most liquid investment grade holdings first.
Exhibit 4: IG has widened proportionately more than HY CLOs, a liquidity signal
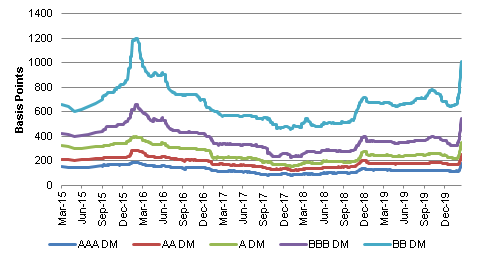
Source: Bloomberg, Palmer Square, Amherst Pierpont Securities
Sound cash flows at wide spreads
‘AAA’ CLO classes still represent fundamentally sound cash flows at wide spreads. The NAIC’s recent stress test of CLOs (reviewed here) using elevated defaults and low recoveries suggested ‘A’ and higher rated classes would not take losses in the tested scenarios. The protection comes partly from loan recoveries but more from diversion of deal cash flow to senior classes as deal credit quality erodes. Credit quality does look likely to erode, but CLO structure should ensure that ‘AAA’ classes still get all cash flows due. The relatively sharper widening in investment grade CLO debt suggests demand for liquidity is disproportionately driving spreads wider in those classes. Investors with cash and a longer investment horizon have a good opportunity in the most highly rated CLO debt.
This material is intended only for institutional investors and does not carry all of the independence and disclosure standards of retail debt research reports. In the preparation of this material, the author may have consulted or otherwise discussed the matters referenced herein with one or more of SCM’s trading desks, any of which may have accumulated or otherwise taken a position, long or short, in any of the financial instruments discussed in or related to this material. Further, SCM may act as a market maker or principal dealer and may have proprietary interests that differ or conflict with the recipient hereof, in connection with any financial instrument discussed in or related to this material.
This message, including any attachments or links contained herein, is subject to important disclaimers, conditions, and disclosures regarding Electronic Communications, which you can find at https://portfolio-strategy.apsec.com/sancap-disclaimers-and-disclosures.
Important Disclaimers
Copyright © 2026 Santander US Capital Markets LLC and its affiliates (“SCM”). All rights reserved. SCM is a member of FINRA and SIPC. This material is intended for limited distribution to institutions only and is not publicly available. Any unauthorized use or disclosure is prohibited.
In making this material available, SCM (i) is not providing any advice to the recipient, including, without limitation, any advice as to investment, legal, accounting, tax and financial matters, (ii) is not acting as an advisor or fiduciary in respect of the recipient, (iii) is not making any predictions or projections and (iv) intends that any recipient to which SCM has provided this material is an “institutional investor” (as defined under applicable law and regulation, including FINRA Rule 4512 and that this material will not be disseminated, in whole or part, to any third party by the recipient.
The author of this material is an economist, desk strategist or trader. In the preparation of this material, the author may have consulted or otherwise discussed the matters referenced herein with one or more of SCM’s trading desks, any of which may have accumulated or otherwise taken a position, long or short, in any of the financial instruments discussed in or related to this material. Further, SCM or any of its affiliates may act as a market maker or principal dealer and may have proprietary interests that differ or conflict with the recipient hereof, in connection with any financial instrument discussed in or related to this material.
This material (i) has been prepared for information purposes only and does not constitute a solicitation or an offer to buy or sell any securities, related investments or other financial instruments, (ii) is neither research, a “research report” as commonly understood under the securities laws and regulations promulgated thereunder nor the product of a research department, (iii) or parts thereof may have been obtained from various sources, the reliability of which has not been verified and cannot be guaranteed by SCM, (iv) should not be reproduced or disclosed to any other person, without SCM’s prior consent and (v) is not intended for distribution in any jurisdiction in which its distribution would be prohibited.
In connection with this material, SCM (i) makes no representation or warranties as to the appropriateness or reliance for use in any transaction or as to the permissibility or legality of any financial instrument in any jurisdiction, (ii) believes the information in this material to be reliable, has not independently verified such information and makes no representation, express or implied, with regard to the accuracy or completeness of such information, (iii) accepts no responsibility or liability as to any reliance placed, or investment decision made, on the basis of such information by the recipient and (iv) does not undertake, and disclaims any duty to undertake, to update or to revise the information contained in this material.
Unless otherwise stated, the views, opinions, forecasts, valuations, or estimates contained in this material are those solely of the author, as of the date of publication of this material, and are subject to change without notice. The recipient of this material should make an independent evaluation of this information and make such other investigations as the recipient considers necessary (including obtaining independent financial advice), before transacting in any financial market or instrument discussed in or related to this material.
Important disclaimers for clients in the EU and UK
This publication has been prepared by Trading Desk Strategists within the Sales and Trading functions of Santander US Capital Markets LLC (“SanCap”), the US registered broker-dealer of Santander Corporate & Investment Banking. This communication is distributed in the EEA by Banco Santander S.A., a credit institution registered in Spain and authorised and regulated by the Bank of Spain and the CNMV. Any EEA recipient of this communication that would like to affect any transaction in any security or issuer discussed herein should do so with Banco Santander S.A. or any of its affiliates (together “Santander”). This communication has been distributed in the UK by Banco Santander, S.A.’s London branch, authorised by the Bank of Spain and subject to regulatory oversight on certain matters by the Financial Conduct Authority (FCA) and the Prudential Regulation Authority (PRA).
The publication is intended for exclusive use for Professional Clients and Eligible Counterparties as defined by MiFID II and is not intended for use by retail customers or for any persons or entities in any jurisdictions or country where such distribution or use would be contrary to local law or regulation.
This material is not a product of Santander´s Research Team and does not constitute independent investment research. This is a marketing communication and may contain ¨investment recommendations¨ as defined by the Market Abuse Regulation 596/2014 ("MAR"). This publication has not been prepared in accordance with legal requirements designed to promote the independence of research and is not subject to any prohibition on dealing ahead of the dissemination of investment research. The author, date and time of the production of this publication are as indicated herein.
This publication does not constitute investment advice and may not be relied upon to form an investment decision, nor should it be construed as any offer to sell or issue or invitation to purchase, acquire or subscribe for any instruments referred herein. The publication has been prepared in good faith and based on information Santander considers reliable as of the date of publication, but Santander does not guarantee or represent, express or implied, that such information is accurate or complete. All estimates, forecasts and opinions are current as at the date of this publication and are subject to change without notice. Unless otherwise indicated, Santander does not intend to update this publication. The views and commentary in this publication may not be objective or independent of the interests of the Trading and Sales functions of Santander, who may be active participants in the markets, investments or strategies referred to herein and/or may receive compensation from investment banking and non-investment banking services from entities mentioned herein. Santander may trade as principal, make a market or hold positions in instruments (or related derivatives) and/or hold financial interest in entities discussed herein. Santander may provide market commentary or trading strategies to other clients or engage in transactions which may differ from views expressed herein. Santander may have acted upon the contents of this publication prior to you having received it.
This publication is intended for the exclusive use of the recipient and must not be reproduced, redistributed or transmitted, in whole or in part, without Santander’s consent. The recipient agrees to keep confidential at all times information contained herein.


