Uncategorized
In gauging oil and gas exposure, focus on price
admin | March 13, 2020
This material is a Marketing Communication and does not constitute Independent Investment Research.
The recent sharp down trade in energy prices has sent CLO investors scrambling to gauge exposure. It is lower than the oil bust of 2014 to 2016 but still meaningful. Exposure varies significantly across CLO deals and managers. Although par exposure to oil and gas loans looks similar across annual vintages, exposure to price looks different. And that could matter if ratings drift lower across industries in coming months and more deals approach their limits on exposure to ‘CCC’ loans.
Energy exposure across leveraged loans lower than 2014-2016
Current oil and gas exposure across the broad leveraged loan market is running lower than its prior peak. Oil and gas loans in February 2014 constituted 4.58% of the S&P/LSTA leveraged loan index but in February stood at 3.20% (Exhibit 1). The average since 2008 is 3.13%. CLOs usually hold a more narrow range of oil and gas names than the broader market.
Exhibit 1: Market index exposure to oil and gas is around the average since 2008

Source: LCD, Amherst Pierpont Securities
Exposure in CLOs runs around 2.5%
CLO oil and gas exposure depends on industry definition—S&P, Moody’s or Markit—but centers around a median of 2.50% with a long tail of higher exposure (Exhibit 2). S&P classification includes energy equipment; Moody’s classification includes utilities from oil and gas; Markit classification is purely oil and gas, which could explain why Markit consistently stands out as showing generally lower concentrations.
Exhibit 2: Energy exposure across CLOs centers around 2.5% with a long tail

Source: S&P, Moody’s, Markit, Amherst Pierpont Securities
Energy exposure in CLO managers’ aggregate portfolio of managed loans also centers around 2.50% with a long tail of higher exposure, suggesting some managers intentionally have above-market exposure to the sector (Exhibit 3). Many but not all of the most highly concentrated managers are small. But some of the CLO market’s largest managers also currently are overweight.
Exhibit 3: Manager exposure also centers around 2.5% with a tail of overweights

Source: S&P, Moody’s, Markit, Amherst Pierpont Securities
Looking across CLO vintages
CLO exposure to oil and gas as a share of portfolio par balance looks similar for now across different annual vintages. The median CLO portfolio holds around 2.50%, the 10th percentile holds 0.6% and the 90th percentile holds 4.6% (Exhibit 4). The differences across vintages are small.
Exhibit 4: Current par exposure to oil and gas loans looks similar across CLO vintages

Note: Loan industry categorized based on Moody’s criteria. Source: Intex, Amherst Pierpont Securities
But using price as a measure of loan quality, vintages start to look different. The 2019 vintage looks the strongest, and the 2014 vintage the weakest. The difference between these vintages in weighted average loan price for the median portfolio is $14—$84.98 for 2019 and $70.90 for 2014.
Exhibit 5: Weighted average price for oil and gas loans across vintage looks more distinct
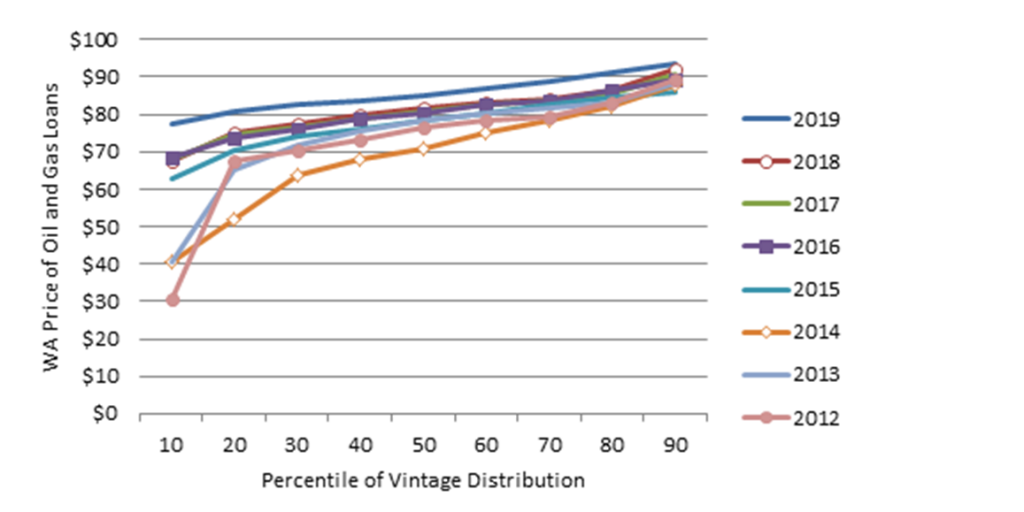
Note: Loans industry categorized based on Moody’s criteria. Source: Intex, Amherst Pierpont Securities
A recent 44% plunge in oil prices
Oil prices continue to trend lower, partly reflecting an expected drop in travel, transportation and general economic activity. The drop also reflects a presumed price war of some duration among oil producers. Depending on the duration of these influences, highly leveraged oil and gas producers could face downgrade or default.
Exhibit 6: Oil prices have dropped 44% since mid-January

Note: data as of 3/10/2020. Source: Bloomberg, Amherst Pierpont Securities
The risk of triggering limits on ‘CCC’ loan holdings
Most CLO managers have a limit of 7.5% of portfolio par balance on loans rated ‘CCC’ or lower. If a manager exceeds the limit because of downgrades in oil and gas or any industry, the price discount from par on the excess ‘CCC’ loans counts against the par balance of the deal, potentially triggering diversion of cash flow from the most junior classes to more senior classes. The reduction in deal par balance usually starts with the lowest priced ‘CCC’ loans first, making the price of ‘CCC’ loans important.
The older vintages of CLO with low oil and gas loan prices could see the sharpest impact if downgrades of any sort fill up the ‘CCC’ bucket. In a leveraged loan market likely to see ratings drift over the next few months, loan price matters as much as par exposure. More recent vintages look the strongest.
This material is intended only for institutional investors and does not carry all of the independence and disclosure standards of retail debt research reports. In the preparation of this material, the author may have consulted or otherwise discussed the matters referenced herein with one or more of SCM’s trading desks, any of which may have accumulated or otherwise taken a position, long or short, in any of the financial instruments discussed in or related to this material. Further, SCM may act as a market maker or principal dealer and may have proprietary interests that differ or conflict with the recipient hereof, in connection with any financial instrument discussed in or related to this material.
This message, including any attachments or links contained herein, is subject to important disclaimers, conditions, and disclosures regarding Electronic Communications, which you can find at https://portfolio-strategy.apsec.com/sancap-disclaimers-and-disclosures.
Important Disclaimers
Copyright © 2026 Santander US Capital Markets LLC and its affiliates (“SCM”). All rights reserved. SCM is a member of FINRA and SIPC. This material is intended for limited distribution to institutions only and is not publicly available. Any unauthorized use or disclosure is prohibited.
In making this material available, SCM (i) is not providing any advice to the recipient, including, without limitation, any advice as to investment, legal, accounting, tax and financial matters, (ii) is not acting as an advisor or fiduciary in respect of the recipient, (iii) is not making any predictions or projections and (iv) intends that any recipient to which SCM has provided this material is an “institutional investor” (as defined under applicable law and regulation, including FINRA Rule 4512 and that this material will not be disseminated, in whole or part, to any third party by the recipient.
The author of this material is an economist, desk strategist or trader. In the preparation of this material, the author may have consulted or otherwise discussed the matters referenced herein with one or more of SCM’s trading desks, any of which may have accumulated or otherwise taken a position, long or short, in any of the financial instruments discussed in or related to this material. Further, SCM or any of its affiliates may act as a market maker or principal dealer and may have proprietary interests that differ or conflict with the recipient hereof, in connection with any financial instrument discussed in or related to this material.
This material (i) has been prepared for information purposes only and does not constitute a solicitation or an offer to buy or sell any securities, related investments or other financial instruments, (ii) is neither research, a “research report” as commonly understood under the securities laws and regulations promulgated thereunder nor the product of a research department, (iii) or parts thereof may have been obtained from various sources, the reliability of which has not been verified and cannot be guaranteed by SCM, (iv) should not be reproduced or disclosed to any other person, without SCM’s prior consent and (v) is not intended for distribution in any jurisdiction in which its distribution would be prohibited.
In connection with this material, SCM (i) makes no representation or warranties as to the appropriateness or reliance for use in any transaction or as to the permissibility or legality of any financial instrument in any jurisdiction, (ii) believes the information in this material to be reliable, has not independently verified such information and makes no representation, express or implied, with regard to the accuracy or completeness of such information, (iii) accepts no responsibility or liability as to any reliance placed, or investment decision made, on the basis of such information by the recipient and (iv) does not undertake, and disclaims any duty to undertake, to update or to revise the information contained in this material.
Unless otherwise stated, the views, opinions, forecasts, valuations, or estimates contained in this material are those solely of the author, as of the date of publication of this material, and are subject to change without notice. The recipient of this material should make an independent evaluation of this information and make such other investigations as the recipient considers necessary (including obtaining independent financial advice), before transacting in any financial market or instrument discussed in or related to this material.
Important disclaimers for clients in the EU and UK
This publication has been prepared by Trading Desk Strategists within the Sales and Trading functions of Santander US Capital Markets LLC (“SanCap”), the US registered broker-dealer of Santander Corporate & Investment Banking. This communication is distributed in the EEA by Banco Santander S.A., a credit institution registered in Spain and authorised and regulated by the Bank of Spain and the CNMV. Any EEA recipient of this communication that would like to affect any transaction in any security or issuer discussed herein should do so with Banco Santander S.A. or any of its affiliates (together “Santander”). This communication has been distributed in the UK by Banco Santander, S.A.’s London branch, authorised by the Bank of Spain and subject to regulatory oversight on certain matters by the Financial Conduct Authority (FCA) and the Prudential Regulation Authority (PRA).
The publication is intended for exclusive use for Professional Clients and Eligible Counterparties as defined by MiFID II and is not intended for use by retail customers or for any persons or entities in any jurisdictions or country where such distribution or use would be contrary to local law or regulation.
This material is not a product of Santander´s Research Team and does not constitute independent investment research. This is a marketing communication and may contain ¨investment recommendations¨ as defined by the Market Abuse Regulation 596/2014 ("MAR"). This publication has not been prepared in accordance with legal requirements designed to promote the independence of research and is not subject to any prohibition on dealing ahead of the dissemination of investment research. The author, date and time of the production of this publication are as indicated herein.
This publication does not constitute investment advice and may not be relied upon to form an investment decision, nor should it be construed as any offer to sell or issue or invitation to purchase, acquire or subscribe for any instruments referred herein. The publication has been prepared in good faith and based on information Santander considers reliable as of the date of publication, but Santander does not guarantee or represent, express or implied, that such information is accurate or complete. All estimates, forecasts and opinions are current as at the date of this publication and are subject to change without notice. Unless otherwise indicated, Santander does not intend to update this publication. The views and commentary in this publication may not be objective or independent of the interests of the Trading and Sales functions of Santander, who may be active participants in the markets, investments or strategies referred to herein and/or may receive compensation from investment banking and non-investment banking services from entities mentioned herein. Santander may trade as principal, make a market or hold positions in instruments (or related derivatives) and/or hold financial interest in entities discussed herein. Santander may provide market commentary or trading strategies to other clients or engage in transactions which may differ from views expressed herein. Santander may have acted upon the contents of this publication prior to you having received it.
This publication is intended for the exclusive use of the recipient and must not be reproduced, redistributed or transmitted, in whole or in part, without Santander’s consent. The recipient agrees to keep confidential at all times information contained herein.


