Uncategorized
Technical analysis of 10s/30s credit curves
admin | March 6, 2020
This material is a Marketing Communication and does not constitute Independent Investment Research.
In aggregate the widening in investment grade credit spreads over the past two weeks has been a roughly parallel shift across the long end of the curve. However, there are individual issuers/issues where the credit curve has steepened materially in the sell-off. The top and bottom movers in the 10s/30s curve among 300+ issuers are identified so that investors can maximize credit compensation for moving out into 30-year notes in select corporate issuers.
Methodology
The 10s/30s credit curves for all IG issuers that have current 10- and 30-year notes outstanding (>300 issuers) were evaluated to compare the spread available to move out the curve in each individual name before the sell-off (2/19/20, unless new issue) versus the current level. Those analytics provide additional insight on performance within and across sectors, identifying the best opportunities to extend duration and pick up spread. G-spreads are used to smooth any differences in maturities (30-year debt runs from 2044-2051, 10-years are 2028-2031), and the most liquid bonds were utilized for each issuer according to Bloomberg/TRACE statistics. Individual recommendations identify the individual bonds from each issuer that offer the best relative value opportunity. This study is a follow-up to APS – Combing the Selloff, which took a closer look at the anatomy of the sell-off in the corporate bond market. Entire list of 300+ issuers available on request.
Exhibit 1: UST and BBB Corporate Yield Curves – Current vs 2/19/20 and Year-End
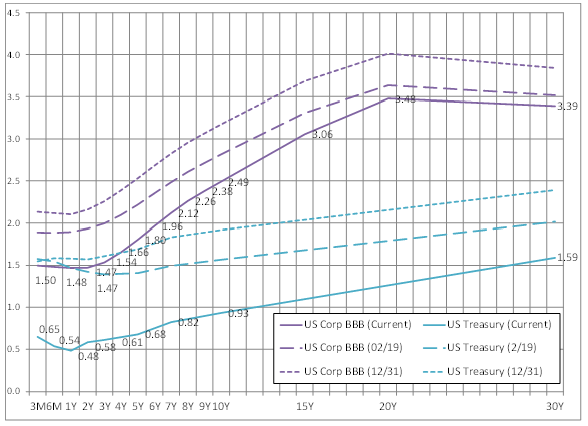
Source: Bloomberg
Exhibit 2: BBB Corporate Spread Curves: Current vs 2/19/20 and Year-End
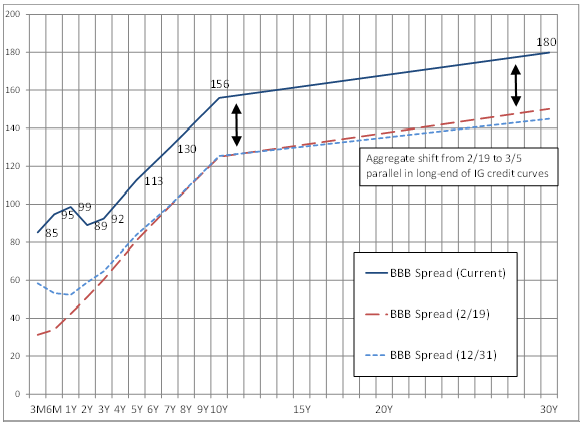
Source: Bloomberg
Generically, the credit spread sell-off has been a parallel shift for the segment (Exhibits 1 & 2) when looking at the aggregate IG market. This implies winners and losers with respect to curve steepness. The average pick-up to extend to 30-year IG corporate debt from 10-year is little changed today (+44) vs before the sell-off (+42), despite the Index widening to +124 from +96. However, the range between max and min for the sample set increased substantially to +187 from +161 before the sell-off. The biggest changes in average 10s/30s spread pick from 2/19 to current are as follows: Energy +11 bp, Nat Gas +14 bp, Consumer Cyclical + 7 bp, Brokers/Asset Mgrs +6 bp, and Technology +4 bp.
While inherently the lower-rated and higher-beta credits appear more likely to see the most steepening in their respective credit curves, this is by no means the sole determinant in how 10s/30s relationships have progressed over the past two weeks. However, several higher rated issuers made their way into the Top 40 results (Exhibit 3). Likewise, some lower-rated names saw their curves flatten. For example, the General Motors (GM: Baa3/BBB) 10s/30s curve steepened substantially, while the Ford Motor (F: Ba1/BBB) curve landed toward the bottom of the list having flattened versus 2/19. While GM is perceived to have a more global footprint, Ford is the weaker credit and one might have expected to see their 10s/30s curve steepen as well. Instead, the incentive to own long GM vs long F notes has improved by more than +40 bp in aggregate.
Exhibit 3. TOP 50 and BOTTOM 20 – 10s/30s steepeners in credit (since 2/19)
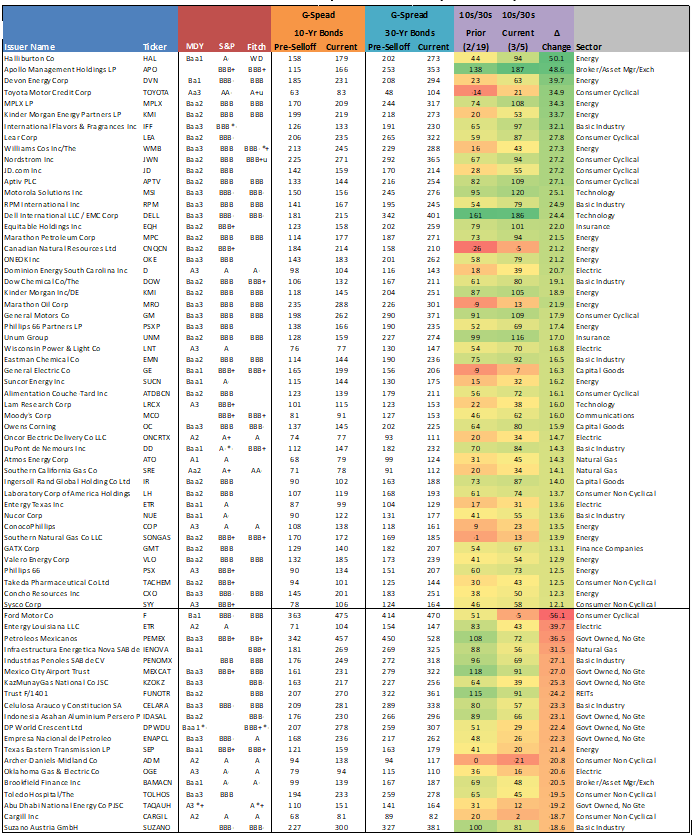
Note: Prior level is 2/19 unless new issue. Source: Bloomberg/TRACE G-spread indications only, Amherst Pierpont Securities
Packaged Food Update: Steep Tyson Curve Provides Attractive Opportunity
Exhibit 4: NA Packaged Food Peer Comparison
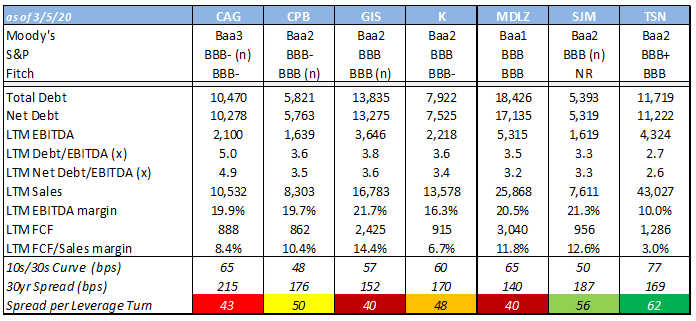
Source: Company reports, Amherst Pierpont Securities
A flight to quality coupled with duration needs had us examining the North American Packaged Food curves for relative value opportunities, particularly in light of J.M Smucker’s (SJM) debt offering. SJM brought $800 million across 10s and 30s this week, pricing with a curve of 55 bp. That curve has now tightened to 50 bp with the new 30-year outperforming the 10-year. Initial price talk indicated a curve of 60 bp, which was roughly in line with average curve of the combined aforementioned credits. Tyson (TSN), despite being the strongest name in the group from a credit perspective, has the steepest curve. Diving deeper, TSN 2048 bonds offer investors the greatest spread per turn of leverage relative to its peer group, followed by SJM’s new 30-year issue.
Leverage Target Lowest Among Peer Group
While the packaged food peers are largely in debt reduction mode post a spate of acquisition activity, only TSN targets leverage below 3.0x. TSN’s long-term target range for net leverage is 2.0x. TSN prioritizes debt reduction in their capital allocation strategy and has historically reduced debt quickly post acquisition. This was underscored by its recent repayment of $1 billion of debt within 10 months of the close of its Keystone acquisition. The debt reduction was funded primarily with cash generated during the quarter. TSN’s strong cash generation should provide for debt reduction of at least $1 billion annually, which should enable them to hit their leverage target by fiscal year-end 2021.
Turn Up the Volume
Volume growth, or lack thereof, has been a persistent negative theme among the packaged food group. In fact in 2019, volumes for the food and beverage sector fell 0.4%. Price increases to offset increased raw material and transportation costs have largely been met with volume declines. However, TSN continues to buck the trend and has posted six consecutive quarters of growth. TSN’s retail volume growth was 3.4% in 2019 (5.2% when just looking at TSN’s core business lines). This compares very favorably to its closest peer SJM, which posted growth of 1.9%.
Exhibit 5: NA Packaged Food – 2019 Volume Growth
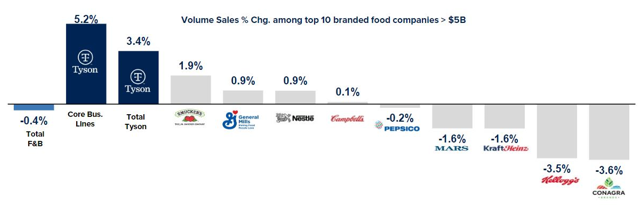
Source: TSN CAGNY Presentation; Nielsen Fixed Volume EQ Sales (52 weeks ended 12/28/19)
Exhibit 6: Consumer Non-Cyclical
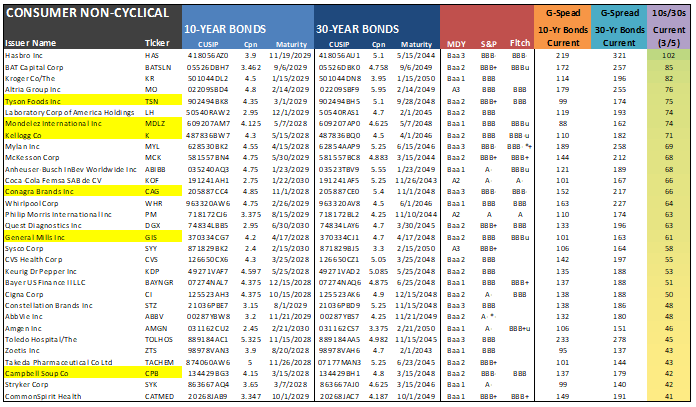
Note: >40 bps only displayed. Source: Bloomberg/TRACE G-spread indications only, Amherst Pierpont Securities
Energy / Basic Materials / Utilities
The Energy segment continues to bear the brunt of much of the coronavirus sell-off so far, with global crude prices selling off roughly 14% since February 19th, and -23% since the beginning of the year. North American pipelines appear unfairly flushed out in this Energy sell-off. While high beta Energy is an easy area for investors to target in periods of global stress, domestic pipeline operators remain comparatively insulated to both foreign events and price fluctuations than Integrated, E&P or Oilfield Services operators. The sell-off appears overdone in these Pipelines names, and investors with higher risk tolerance and the ability to withstand near-term volatility should take the opportunity to increase exposure to this particular subgroup. There is increased spread pick available to move out the curve in the higher-quality names (highlighted in Exhibit 7), such as Dominion Energy Gas Holdings (D), Enterprise Products Operating LLC (EPD), and TransCanada Pipelines, Ltd (TRPCN).
Exhibit 7: Energy
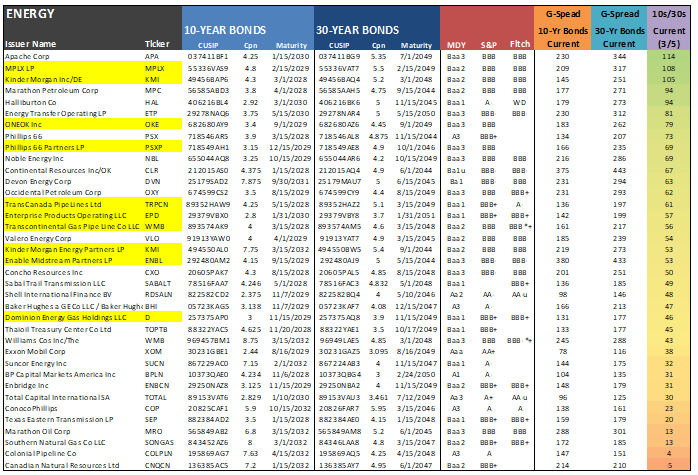
Source: Bloomberg/TRACE G-spread indications only, Amherst Pierpont Securities
Tables covering additional sectors available here.
This material is intended only for institutional investors and does not carry all of the independence and disclosure standards of retail debt research reports. In the preparation of this material, the author may have consulted or otherwise discussed the matters referenced herein with one or more of SCM’s trading desks, any of which may have accumulated or otherwise taken a position, long or short, in any of the financial instruments discussed in or related to this material. Further, SCM may act as a market maker or principal dealer and may have proprietary interests that differ or conflict with the recipient hereof, in connection with any financial instrument discussed in or related to this material.
This message, including any attachments or links contained herein, is subject to important disclaimers, conditions, and disclosures regarding Electronic Communications, which you can find at https://portfolio-strategy.apsec.com/sancap-disclaimers-and-disclosures.
Important Disclaimers
Copyright © 2026 Santander US Capital Markets LLC and its affiliates (“SCM”). All rights reserved. SCM is a member of FINRA and SIPC. This material is intended for limited distribution to institutions only and is not publicly available. Any unauthorized use or disclosure is prohibited.
In making this material available, SCM (i) is not providing any advice to the recipient, including, without limitation, any advice as to investment, legal, accounting, tax and financial matters, (ii) is not acting as an advisor or fiduciary in respect of the recipient, (iii) is not making any predictions or projections and (iv) intends that any recipient to which SCM has provided this material is an “institutional investor” (as defined under applicable law and regulation, including FINRA Rule 4512 and that this material will not be disseminated, in whole or part, to any third party by the recipient.
The author of this material is an economist, desk strategist or trader. In the preparation of this material, the author may have consulted or otherwise discussed the matters referenced herein with one or more of SCM’s trading desks, any of which may have accumulated or otherwise taken a position, long or short, in any of the financial instruments discussed in or related to this material. Further, SCM or any of its affiliates may act as a market maker or principal dealer and may have proprietary interests that differ or conflict with the recipient hereof, in connection with any financial instrument discussed in or related to this material.
This material (i) has been prepared for information purposes only and does not constitute a solicitation or an offer to buy or sell any securities, related investments or other financial instruments, (ii) is neither research, a “research report” as commonly understood under the securities laws and regulations promulgated thereunder nor the product of a research department, (iii) or parts thereof may have been obtained from various sources, the reliability of which has not been verified and cannot be guaranteed by SCM, (iv) should not be reproduced or disclosed to any other person, without SCM’s prior consent and (v) is not intended for distribution in any jurisdiction in which its distribution would be prohibited.
In connection with this material, SCM (i) makes no representation or warranties as to the appropriateness or reliance for use in any transaction or as to the permissibility or legality of any financial instrument in any jurisdiction, (ii) believes the information in this material to be reliable, has not independently verified such information and makes no representation, express or implied, with regard to the accuracy or completeness of such information, (iii) accepts no responsibility or liability as to any reliance placed, or investment decision made, on the basis of such information by the recipient and (iv) does not undertake, and disclaims any duty to undertake, to update or to revise the information contained in this material.
Unless otherwise stated, the views, opinions, forecasts, valuations, or estimates contained in this material are those solely of the author, as of the date of publication of this material, and are subject to change without notice. The recipient of this material should make an independent evaluation of this information and make such other investigations as the recipient considers necessary (including obtaining independent financial advice), before transacting in any financial market or instrument discussed in or related to this material.
Important disclaimers for clients in the EU and UK
This publication has been prepared by Trading Desk Strategists within the Sales and Trading functions of Santander US Capital Markets LLC (“SanCap”), the US registered broker-dealer of Santander Corporate & Investment Banking. This communication is distributed in the EEA by Banco Santander S.A., a credit institution registered in Spain and authorised and regulated by the Bank of Spain and the CNMV. Any EEA recipient of this communication that would like to affect any transaction in any security or issuer discussed herein should do so with Banco Santander S.A. or any of its affiliates (together “Santander”). This communication has been distributed in the UK by Banco Santander, S.A.’s London branch, authorised by the Bank of Spain and subject to regulatory oversight on certain matters by the Financial Conduct Authority (FCA) and the Prudential Regulation Authority (PRA).
The publication is intended for exclusive use for Professional Clients and Eligible Counterparties as defined by MiFID II and is not intended for use by retail customers or for any persons or entities in any jurisdictions or country where such distribution or use would be contrary to local law or regulation.
This material is not a product of Santander´s Research Team and does not constitute independent investment research. This is a marketing communication and may contain ¨investment recommendations¨ as defined by the Market Abuse Regulation 596/2014 ("MAR"). This publication has not been prepared in accordance with legal requirements designed to promote the independence of research and is not subject to any prohibition on dealing ahead of the dissemination of investment research. The author, date and time of the production of this publication are as indicated herein.
This publication does not constitute investment advice and may not be relied upon to form an investment decision, nor should it be construed as any offer to sell or issue or invitation to purchase, acquire or subscribe for any instruments referred herein. The publication has been prepared in good faith and based on information Santander considers reliable as of the date of publication, but Santander does not guarantee or represent, express or implied, that such information is accurate or complete. All estimates, forecasts and opinions are current as at the date of this publication and are subject to change without notice. Unless otherwise indicated, Santander does not intend to update this publication. The views and commentary in this publication may not be objective or independent of the interests of the Trading and Sales functions of Santander, who may be active participants in the markets, investments or strategies referred to herein and/or may receive compensation from investment banking and non-investment banking services from entities mentioned herein. Santander may trade as principal, make a market or hold positions in instruments (or related derivatives) and/or hold financial interest in entities discussed herein. Santander may provide market commentary or trading strategies to other clients or engage in transactions which may differ from views expressed herein. Santander may have acted upon the contents of this publication prior to you having received it.
This publication is intended for the exclusive use of the recipient and must not be reproduced, redistributed or transmitted, in whole or in part, without Santander’s consent. The recipient agrees to keep confidential at all times information contained herein.


