


Uncategorized
A model of CLO spreads
admin | February 28, 2020
This material is a Marketing Communication and does not constitute Independent Investment Research.
Outside of a few markets with continual trading or quoted bids and offers, pricing securities often starts with some benchmark and then adjusts for each security’s particular differences. For CLOs, it turns out that a handful of features can explain most of the daily price differences between securities. From ‘AAA’ down to ‘BB,’ price largely depends on structure, the past performance of the manager, the quality of the loans and general market conditions. The impact of these features changes across rating categories, with structure and loan quality becoming more important as rating declines. None of this should come as a surprise to seasoned traders or investors, but a model can make CLO pricing more transparent and help manage risk and return.
The approach
The CLO market sees a routine flow of bid lists that provide indicated prices on a wide range of securities. From July 2018 to October 2019, for instance, the market saw at least 4,869 securities offered from ‘AAA’ through ‘BB’ (Exhibit 1). The flow of securities over that period showed a wide range of differences in coupon, callability, remaining reinvestment, loan collateral and managers. Market conditions also varied with the price of the S&P/LSTA leveraged loan index ranging from $98.7 to $93.8.
Exhibit 1: A sample of securities bid in the secondary market from 7/1/18 to 10/1/19.
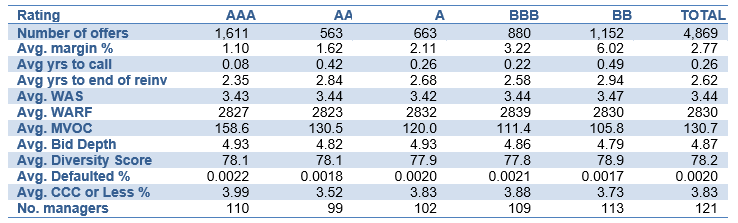
Source: Amherst Pierpont Securities
This range of secondary pricing allows a good look at the ability of differences between securities to explain differences in prices. Using regression to do the work, differences between securities’ attributes explain roughly 80% to 90% of the differences in price, or, more specifically, in pricing spread across CLO rating categories (Exhibit 2). More interesting than the overall ability to explain price, however, is the separate, underlying value of each CLO feature.
Exhibit 2: Total spread variance explained in each rating category
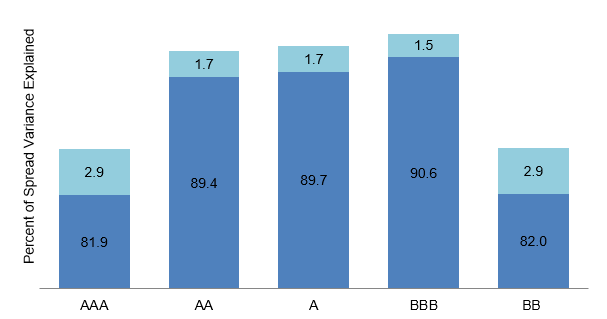
Source: Amherst Pierpont Securities
Starting with structure
A few elements of CLO structure have the biggest impact on pricing:
- Rating
- Margin over LIBOR, and
- Callability and time left for reinvestment
CLO structure has the largest impact on CLO spread or discount margin, beginning with the obvious importance of rating. Spreads ranged from an average ‘AAA’ of 121.4 to an average ‘BB’ of 655.4 (Exhibit 3). Spreads clearly vary over time, and a spread index, such as those published for each CLO rating category by Palmer Square, can help reset the right level day-to-day.
Exhibit 3: Average spread from ‘AAA’ to ‘BB’
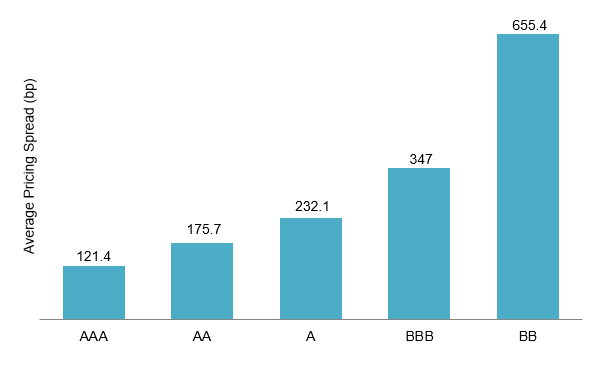
Source: Amherst Pierpont Securities
Margin over LIBOR has a big impact on pricing spread since it signals a CLO’s loan quality and its incentives to refinance. Higher margins usually signal an initial and continuing loan portfolio with higher risk. In this respect, margin carrys some of the same information as weighted average spread or rating factor. Higher margins also make a CLO more likely to refinance in periods of tightening spreads, and investors need continuing compensation for the refinancing risk. All else equal, for every added basis point of ‘AAA’ margin, the ‘AAA’ spread widens roughly 1 bp. For every added basis point of ‘BB’ margin, however, the ‘BB’ spread widens 5 bp (Exhibit 4).
Exhibit 4: Higher margin predicts wider spread
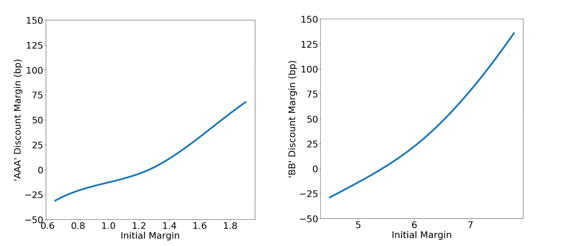
Source: Amherst Pierpont Securities
The difference between CLO margin and current market spreads in a rating category specifically measures immediate potential to refinance. As the spread between CLO margin and current market levels rises, the CLO becomes more refinanceable. The price approaches par, and the spread at par approaches the CLO’s margin over LIBOR (Exhibit 5).
Exhibit 5: Wider spread between initial margins and current market level pull prices to par
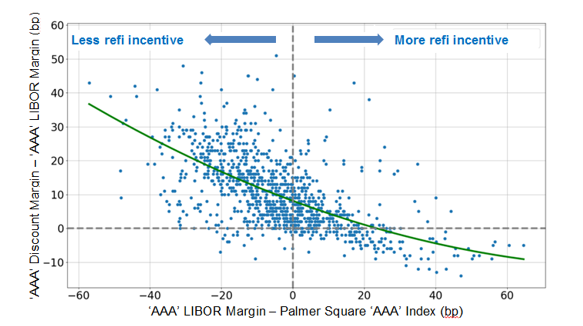
Source: Amherst Pierpont Securities
Finally, the time left in the CLO non-call period and the time left for reinvestment also matter. The effect of the non-call period is complex. Spreads should widen through the non-call period as the risk of refinancing gets closer. But after the period closes, spreads should tighten as the deal nears the end of reinvestment and CLO debt starts to amortize and deleverage the deal. Because the time left in the non-call period and the time left for reinvestment track each other closely, it is difficult to completely measure the independent effects.
The impact of manager
Manager performance also affects spreads in at least two ways:
- The track record of returns on portfolios of leveraged loans arguably says something about the manager’s core business, which should influence CLO debt spreads, and
- A track record of relatively tight or wide spreads on new liabilities also signals, among other things, the relatively liquidity of the debt
Managers who deliver consistently better returns over the broad loan market, adjusted for risk, warrant tighter spreads. If return on the loan market overall is 1%, and a manager’s return during the same period is 1.5%, then the manager’s excess return, also known as alpha, is 0.5%. If this manager only occasionally outperforms the market to achieve positive alpha, rather than creating steady alpha across time, then its alpha adjusted for volatility is low. Steady producers of excess return clearly produce a steady stream of earnings to equity. To the extent return comes from loan price, a steady manager also outperforms peers on MVOC, helping the performance of speculative grade CLO debt. Even investors in ‘AAA’ debt have exposure to the performance of the underlying loan portfolio.
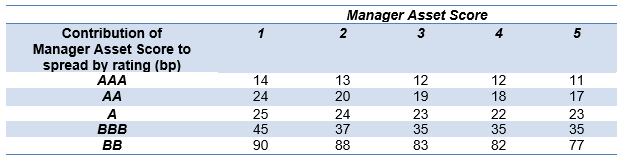
Amherst Pierpont has devised a measure called Manager Asset Score based on alpha adjusted by volatility, also known as information ratio. This score first ranks the managers based on their information ratios then assigns them star ratings from worst (1) to best (5). Manager Asset Score affects spreads in each rating category (Exhibit 6). Moving from a score of 1 to a score of 5 tightens spreads in each rating category, with the amount of tightening increasing as rating falls. For example, the difference between a ‘AAA’ with a Manager Asset Score of 1 and a ‘AAA’ with a score of 5 is 3 bp. But the difference for ‘BB’ is 13 bp. In the parts of the capital structure closer to equity, manager performance understandably matters more.
Exhibit 6: Spreads tighten as Manager Asset Score rises
Source: Amherst Pierpont Securities
Managers who price debt tighter than their peers at issuance typically see that relationship carry over to the secondary market. A manager who has issued 20 deals to date, has broad distribution and an active secondary, for instance, tends to be more liquid than a brand-new manager introducing its first deal. The more liquid manager, all else equal, the tighter the secondary spread.
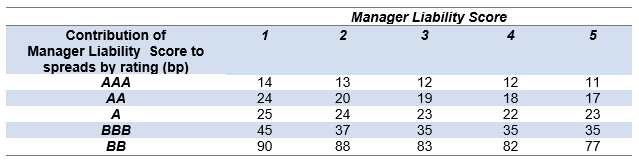
In concert with Manager Asset Score, APS has created the Manager Liability Score based on spreads of new-issue deals for each manager. This scoring system first ranks each manager by comparing the issuance spreads of its deals to those of its peers’ with the same credit rating and issuance month. It then assigns a score between 1 and 5, with 1 being the tightest. The Manager Liability Score affects spreads in each rating category (Exhibit 7). Again, the impact of the liability score rises as the debt rating falls.
Exhibit 7: Spreads widen as Manager Liability Score rises
Source: Amherst Pierpont Securities
Honing in on the collateral
The current characteristics of CLO loan collateral get careful attention and naturally shape spreads. Among the key features:
- Weighted average rating factor, or WARF
- Weighted average spread, or WAS
- Portfolio diversity score
- Exposure to ‘CCC’ and defaulted loans, and
- Loan liquidity or bid depth
The quality of the collateral securing CLO debt matters for its pricing. All else equal, including levels of structural subordination, debt backed by riskier collateral should trade at wider spreads. And the lower the rating of the debt, the bigger the impact of collateral quality.
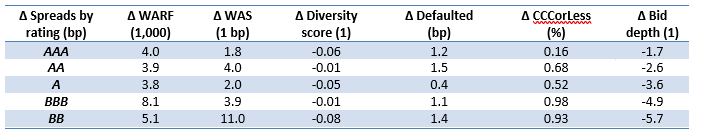
WARF is the weighted average rating factor of individual loans. The factors reflect 10-year probabilities of default on the loans and range from 940 for ‘Ba1’ to 8,070 for ‘Caa3’ and 10,000 for defaults. WAS is a par-weighted average spread across performing, floating-rate loans. If these two metrics deteriorate, all else being equal, the CLO will be riskier and spreads should widen (Exhibit 8).
Diversity score gauges the diversification of the loans across industries and issuers. When the loans are well diversified, their performance is less correlated, such that if one loan defaults then other loans are less likely to be affected. A higher diversification score, with other attributes held constant, indicates that the CLO is a safer investment and generally prices at a tighter spread (Exhibit 8).
The percentages of ‘CCC’ and defaulted loans help monitor the tail of risk, or risks of loans with the highest chances of default. Mezzanine tranches in CLOs are particularly sensitive to tail risk because they have less credit support. For instance, a rise in percentage of ‘CCC’ loans from 0% to 10% corresponds to only 1.6 bp widening in ‘AAA’ but more than 9 bp of widening in ‘BBB’ and ‘BB’ (Exhibit 8).
Bid depth summarizes the liquidity risk of loans by tallying the number of market makers and averaging those counts. A low bid depth implies more difficulty finding loan buyers during episodes of market stress. A higher bid depth is consequently more favorable. For example, a rise in bid depth from 3 to 6 leads to about 5 bp of tightening in ‘AAA’ and 17 bp of tightening in ‘BB’ (Exhibit 8).
Exhibit 8: Spreads change in accordance with collateral dynamics
Source: Amherst Pierpont Securities
Macro Conditions
Broad market conditions matter, too:
- The general level of prices on leveraged loans, and
- The general level of spreads on CLO debt
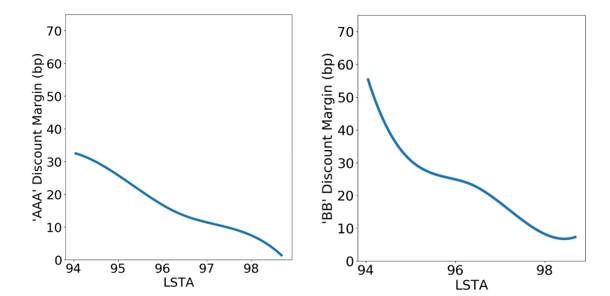
Current loan prices drive CLO spreads. If loans trade at low prices or wide spreads, the CLO market has room to issue wider debt. That drags spreads on secondary positions wider, too. The S&P LSTA price index, which tracks the prices of U.S. leveraged loans, helps to recalibrate the spread model each day with the latest loan prices. A 1-point drop in the LSTA price index leads to about 7 bp of widening in ‘AAA’ and different degrees of widening in ‘BB’ (Exhibit 9). Spreads in ‘BB’ widen quickly below a threshold on the price index. When the LSTA price index is above 96, for instance, ‘BB’ spreads widen by around 10 basis points per point drop. When the index falls below 94, however, ‘BB’ spreads tend to widen by as much as 30 basis points per point drop. This faster pace of widening can be attributed to a severe selloff in the loan market and insufficient MVOC cushion to cover the ‘BB’ classes.
Exhibit 9: Rising loan prices relate to tighter CLO ‘AAA’ and ‘BB’ spreads
Source: Amherst Pierpont Securities
Current spreads in the secondary market also affect CLO pricing, as they are considered for the refinancing incentive of a deal. For each rating category, Palmer Square provides an index on the current spreads in the secondary market. A sufficiently large excess of a CLO security’s coupon above the current spreads of its rating category will incentivize equity holders to refinance the deal. As this incentive grows, the price of the CLO security will approach par, as the expectation of refinancing becomes more certain (Exhibit 5).
Explaining residual spreads with leverage
Then there’s the pricing element where market conditions cross paths with the manager’s portfolio performance and with the CLO structure: market value over-collateralization, or MVOC, which measures the amount of loan market value available to repay a CLO class. MVOC corresponds to the amount of leverage in the structure. As MVOC falls, leverage rises. And as MVOC for a class of CLO debt approaches 100, leverage rises exponentially. As leverage rises in any asset class, investors demand more spread.
Leverage ends up being an element of risk that crosses CLO debt classes (Exhibit 7). At a similar level of leverage, a 2x leveraged ‘AA’ should offer some information about the right spread level for a 2x leveraged ‘AAA.’
Exhibit 10: Ranges of leverage and MVOC overlap across rating categories
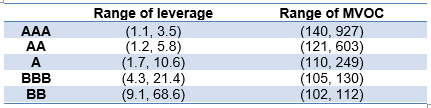
Sources: Amherst Pierpont Securities
Using regression again to do the work, leverage explains 16% of the residual price variations across rating categories (Exhibit 2). Moreover, the contribution of leverage to residual spreads rises sharply in ‘BBB’ and ‘BB’ classes (Exhibit 11).
Exhibit 11: Residual spreads rise as leverage accumulates across rating categories
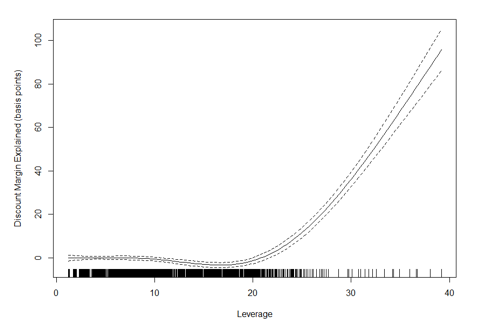
Sources: Amherst Pierpont Securities
Improving accuracy further through reducing bias
While quantifiable characteristics of CLOs explain a large part of security-to-security price differences, the relationships can change over time. Qualitative aspects of CLOs also are not directly measured in the model. Shifting relationships and unmeasured variables can lead to bias in predictions. Reducing this bias by averaging recent errors and correcting them helps improve accuracy. The final estimates after adjusting for the average difference between observed and fitted spreads in a 30-day rolling window are much closer to the observed spreads (Exhibit 12).
Exhibit 12: Final ‘BB’ estimates come much closer to observed ‘BB’ spreads
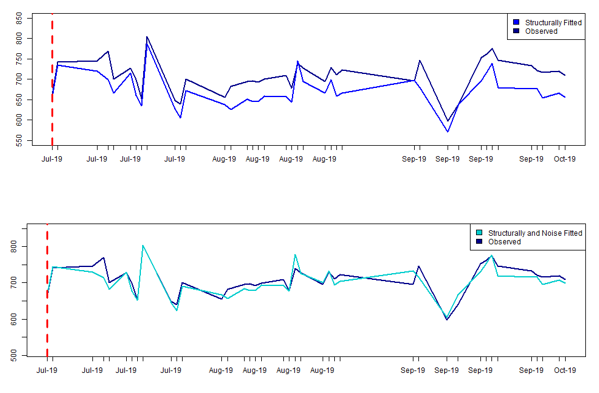
Sources: Amherst Pierpont Securities
Use cases of the CLO spread model
A good CLO spread model not only helps provide pricing estimates but also measures the influence of specific CLO attributes. The frequent updating of a good model keeps it calibrated to dynamic market conditions.
As in any market, easier pricing should make relative value easier to spot. CLO debt that trades wide or tight to modeled fair value either is unique in some way that warrants the price difference or it is mispriced.
Easier pricing also should make scenario analysis and CLO hedging easier. This is especially valuable as loan prices move and MVOC and leverage on CLO classes change. CLOs are notoriously difficult to hedge and show low correlation with a wide range of potential offsetting instruments. But the strongly nonlinear relationship between leverage and spread arguably explains the low correlation. Correlation only works for linear relationships. CLOs, especially ones with MVOC below 110, should be delta-hedged—the hedge getting reset as MVOC moves. But that is work still to be done.