Uncategorized
Wage check
admin | February 21, 2020
This material is a Marketing Communication and does not constitute Independent Investment Research.
The Fed recently has argued that the average US paycheck is tracking productivity growth and inflation, so wages look consistent with a balanced labor market instead of a tight one. But using the Fed’s own framework, a closer look at wage growth over the last 25 years or so suggests that labor markets are, in fact, pretty tight.
Inputs to wage growth
In theory, a firm should willingly pay its workers based on some function of real output from the workers along with some allowance for inflation. Wage growth should track productivity growth, a gauge of the additional increment that each hour of work provides in real output from one period to the next, along with inflation.
There are two complications with this approach. First, the data, especially for productivity, are notoriously noisy. When productivity growth gyrates from year to year or inflation swings higher or lower driven by oil prices, wage gains would not necessarily follow. Second, expectations are probably as important, if not more important, than backward-looking data. For example, as workers negotiate a wage package, especially a multi-year deal, they should want compensation for inflation expected over the term of the contract rather than for inflation in the past. This is one key reason why low and stable inflation helps the economy; it eliminates a key source of uncertainty for business planning.
A survey from the Philadelphia Fed offers a way around some of the noise. A Philly Fed survey in place for decades asks for 10-year projections of productivity as well as inflation. Using these 10-year expectations results offers an escape from the short-term noise in the actual data as well as offering an insight into all-important forward expectations, as opposed to backward-looking data. I use the 10-year productivity projections as well as the 10-year projections for the Fed’s preferred gauge of inflation, the PCE deflator.
We can then look at the sum of long-term productivity and inflation projections as a benchmark for wage gains (Exhibit 1). Going back to the 1990s, the projected trend in productivity growth has decelerated significantly, which is why it is unfair to expect wage gains to be as fast today as they were 20 years ago.
Exhibit 1: Projections of productivity growth plus inflation
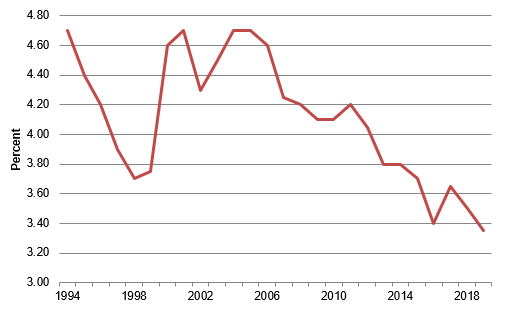
Source: Philadelphia Fed Survey of Professional Forecasters.
New Gauge of Labor Market Slack
The next step in the calculation is to compare actual wage growth to the proxy of trend wage growth. One good metric is the average hourly earnings for production and nonsupervisory workers. Subtracting the proxy from actual wage gains–using the December-to-December increase for each year to construct an annual series—provides a measure of wages relative to one concept of “equilibrium” (Exhibit 2).
Exhibit 2: Wages compared to a proxy of projected wages
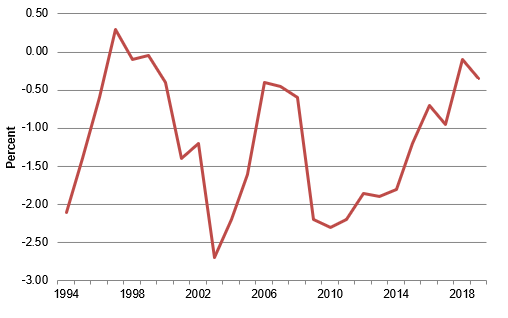
Source: BLS, Philadelphia Fed Survey of Professional Forecasters.
Among other things, the series is almost always in negative territory. This could reflect any number of issues, but my first guess would be that benefit costs such as health insurance have generally gone up faster than wages over this period, so workers may be settling for slower increases in base pay to achieve their desired mix of fringe benefits. Alternatively, workers could have simply lost bargaining power over time.
Additionally, and more importantly for our purposes, the series appears to offer a surprisingly reliable gauge of the state of the labor market. During expansions, when labor markets are growing tighter, the series is almost always rising, and then it plunges during recessions, when slack builds quickly. Looking more precisely, the series suggests that wages may respond to the economy with a slight lag, as the big drop in the gap comes a year or two after the recession begins, which is consistent with the bulk of economic research showing that movements in wage growth do tend to lag somewhat. This is a phenomenon that makes sense, as many workers only negotiate wages once a year, or, in the case of unionized workers, even less frequently, so it takes a bit of time for wages to adjust to an economic downturn.
Exhibit 3 compares the gap portrayed in Exhibit 2 with the unemployment rate using an inverted scale. The correlation is amazingly tight, which confirms that the proxy constructed here is indeed a solid indicator of the state of the labor market.
Exhibit 3: Wage gap proxy versus the unemployment rate
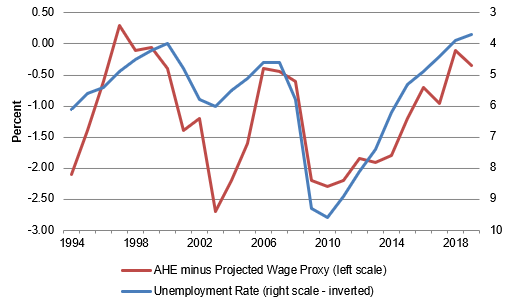
Source: BLS, Philadelphia Fed Survey of Professional Forecasters.
Where do we stand?
During an era when productivity growth has varied widely, making it difficult to compare nominal wage growth across business cycles, the proxy created here offers a much better way to compare the state of the labor market over different time periods. The gap registered just below zero in 2018 and 2019, slightly higher than the peak readings seen in the expansion of the 2000s, but just below the best observations of the late-1990s, the last time that the unemployment rate slid below 4%. The gap series jumped into positive territory in 1997, which appears to be an anomaly, but settled at -0.1% in 1998 and -0.05% in 1999. By comparison, the 2018 reading was consistent with the 1998/1999 figures at -0.1%, but the modest deceleration in wages last year took the gap proxy down to -0.35% last year. In any case, that late-1990s period has been widely viewed as the tightest labor market since the 1960s, and the key question that I have been grappling with in recent months is how to compare the current labor market environment with that time. This gauge confirms my sense that the current labor market is either on par with the late-1990s or slightly less tight.
It is worth noting that the deceleration in average hourly earnings growth in 2019 relative to 2018 seems at odds with most anecdotal and survey evidence that the labor market has continued to tighten. Indeed, in the January FOMC minutes, from which I lifted the quote in the introduction, several participants noted that their business contacts indicated that “observed wage growth might currently understate the degree of tightness in the labor market.” If wage gains re-accelerate this year, as I expect, then the gap proxy depicted in Exhibits 2 and 3 will presumably move back to around the zero level, consistent with the 1998/1999 period.
The wage proxy developed in this piece offers support for the view that the labor market is in fact quite tight, though possibly not quite to the extremes reached in the late-1990s – yet. However, it appears to be a far cry from the view of many doves on the FOMC, who have argued that the “absence of stronger broad-based wage pressures” may indicate that “the labor market was not as tight as the historically low unemployment rate would suggest.” After adjusting for the changes in the projected trend of productivity growth, even 3% average hourly earnings growth appears to be consistent with a labor market operating well beyond its long-run equilibrium.
This material is intended only for institutional investors and does not carry all of the independence and disclosure standards of retail debt research reports. In the preparation of this material, the author may have consulted or otherwise discussed the matters referenced herein with one or more of SCM’s trading desks, any of which may have accumulated or otherwise taken a position, long or short, in any of the financial instruments discussed in or related to this material. Further, SCM may act as a market maker or principal dealer and may have proprietary interests that differ or conflict with the recipient hereof, in connection with any financial instrument discussed in or related to this material.
This message, including any attachments or links contained herein, is subject to important disclaimers, conditions, and disclosures regarding Electronic Communications, which you can find at https://portfolio-strategy.apsec.com/sancap-disclaimers-and-disclosures.
Important Disclaimers
Copyright © 2026 Santander US Capital Markets LLC and its affiliates (“SCM”). All rights reserved. SCM is a member of FINRA and SIPC. This material is intended for limited distribution to institutions only and is not publicly available. Any unauthorized use or disclosure is prohibited.
In making this material available, SCM (i) is not providing any advice to the recipient, including, without limitation, any advice as to investment, legal, accounting, tax and financial matters, (ii) is not acting as an advisor or fiduciary in respect of the recipient, (iii) is not making any predictions or projections and (iv) intends that any recipient to which SCM has provided this material is an “institutional investor” (as defined under applicable law and regulation, including FINRA Rule 4512 and that this material will not be disseminated, in whole or part, to any third party by the recipient.
The author of this material is an economist, desk strategist or trader. In the preparation of this material, the author may have consulted or otherwise discussed the matters referenced herein with one or more of SCM’s trading desks, any of which may have accumulated or otherwise taken a position, long or short, in any of the financial instruments discussed in or related to this material. Further, SCM or any of its affiliates may act as a market maker or principal dealer and may have proprietary interests that differ or conflict with the recipient hereof, in connection with any financial instrument discussed in or related to this material.
This material (i) has been prepared for information purposes only and does not constitute a solicitation or an offer to buy or sell any securities, related investments or other financial instruments, (ii) is neither research, a “research report” as commonly understood under the securities laws and regulations promulgated thereunder nor the product of a research department, (iii) or parts thereof may have been obtained from various sources, the reliability of which has not been verified and cannot be guaranteed by SCM, (iv) should not be reproduced or disclosed to any other person, without SCM’s prior consent and (v) is not intended for distribution in any jurisdiction in which its distribution would be prohibited.
In connection with this material, SCM (i) makes no representation or warranties as to the appropriateness or reliance for use in any transaction or as to the permissibility or legality of any financial instrument in any jurisdiction, (ii) believes the information in this material to be reliable, has not independently verified such information and makes no representation, express or implied, with regard to the accuracy or completeness of such information, (iii) accepts no responsibility or liability as to any reliance placed, or investment decision made, on the basis of such information by the recipient and (iv) does not undertake, and disclaims any duty to undertake, to update or to revise the information contained in this material.
Unless otherwise stated, the views, opinions, forecasts, valuations, or estimates contained in this material are those solely of the author, as of the date of publication of this material, and are subject to change without notice. The recipient of this material should make an independent evaluation of this information and make such other investigations as the recipient considers necessary (including obtaining independent financial advice), before transacting in any financial market or instrument discussed in or related to this material.
Important disclaimers for clients in the EU and UK
This publication has been prepared by Trading Desk Strategists within the Sales and Trading functions of Santander US Capital Markets LLC (“SanCap”), the US registered broker-dealer of Santander Corporate & Investment Banking. This communication is distributed in the EEA by Banco Santander S.A., a credit institution registered in Spain and authorised and regulated by the Bank of Spain and the CNMV. Any EEA recipient of this communication that would like to affect any transaction in any security or issuer discussed herein should do so with Banco Santander S.A. or any of its affiliates (together “Santander”). This communication has been distributed in the UK by Banco Santander, S.A.’s London branch, authorised by the Bank of Spain and subject to regulatory oversight on certain matters by the Financial Conduct Authority (FCA) and the Prudential Regulation Authority (PRA).
The publication is intended for exclusive use for Professional Clients and Eligible Counterparties as defined by MiFID II and is not intended for use by retail customers or for any persons or entities in any jurisdictions or country where such distribution or use would be contrary to local law or regulation.
This material is not a product of Santander´s Research Team and does not constitute independent investment research. This is a marketing communication and may contain ¨investment recommendations¨ as defined by the Market Abuse Regulation 596/2014 ("MAR"). This publication has not been prepared in accordance with legal requirements designed to promote the independence of research and is not subject to any prohibition on dealing ahead of the dissemination of investment research. The author, date and time of the production of this publication are as indicated herein.
This publication does not constitute investment advice and may not be relied upon to form an investment decision, nor should it be construed as any offer to sell or issue or invitation to purchase, acquire or subscribe for any instruments referred herein. The publication has been prepared in good faith and based on information Santander considers reliable as of the date of publication, but Santander does not guarantee or represent, express or implied, that such information is accurate or complete. All estimates, forecasts and opinions are current as at the date of this publication and are subject to change without notice. Unless otherwise indicated, Santander does not intend to update this publication. The views and commentary in this publication may not be objective or independent of the interests of the Trading and Sales functions of Santander, who may be active participants in the markets, investments or strategies referred to herein and/or may receive compensation from investment banking and non-investment banking services from entities mentioned herein. Santander may trade as principal, make a market or hold positions in instruments (or related derivatives) and/or hold financial interest in entities discussed herein. Santander may provide market commentary or trading strategies to other clients or engage in transactions which may differ from views expressed herein. Santander may have acted upon the contents of this publication prior to you having received it.
This publication is intended for the exclusive use of the recipient and must not be reproduced, redistributed or transmitted, in whole or in part, without Santander’s consent. The recipient agrees to keep confidential at all times information contained herein.


