Uncategorized
A surprise cut to junk
admin | February 21, 2020
This material is a Marketing Communication and does not constitute Independent Investment Research.
S&P recently cut Macy’s (M) rating one notch to junk (BB+ with a stable outlook), slightly surprising markets. The downgrade reflected its view that M’s improvements are weaker than expected. The agency further remarked that while Macy’s newly unveiled Polaris strategic plan is necessary to rightsizing the business, execution risks remains elevated. Since Macy’s ratings from Moody’s and Fitch are still at the low BBB level roughly $2 billion of Macy’s bonds will remain in the IG Index, which could provide some support for spreads.
We were surprised by the cut as we do believe M has done a considerable job in reducing leverage. Management has been using asset sale and free cash flow proceeds to chip away at debt levels helping to bring adjusted leverage closer to its target range of 2.5x-2.8x. Adjusted leverage including asset sale gains was 2.9x at FYE19 (3.0x excluding the gains), after repaying $565m of debt this year. While M continues to pay a dividend, share repurchases have remained on hold, despite the stock being close to a 52 week low at $16.25. Furthermore, debt reduction has outpaced the dividend payment for the past three years, underscoring management’s commitment to bringing leverage within its target range.
S&P’s stable outlook reflects its view that cost saving initiatives associated with the Polaris plan should offset expected sales declines. S&P also believes that leverage is likely to be maintained at 3.0x or lower over the following year as they expect M to continue to reduce debt. Additionally, S&P noted that they could consider raising M’s rating should the company stabilize sales performance and improve margins while keeping leverage below 3.0x. Historically, adjusted leverage of 3.5x or greater has long been the threshold for a downgrade to junk for a retailer. (Moody’s threshold from its last publication is 3.75x while Fitch’s is 3.5x). Given that leverage is currently at 2.9x and is expected to be maintained at or below that level as M works through its “transition year” underscores the surprise in the downgrade.
Target Leverage Ratio By 2022
M dedicated a couple of slides at its analyst day discussing its capital structure and its commitment to hitting its leverage target over the next three years. M guided to cumulative free cash flow of $1.9-to-$2.3 billion over the next three years. Additionally they plan to monetize approximately $700 million of assets over the same time period. That said, M plans to reduce net debt in the $0.7-to-$1.0 billion range by 2022. This could be done without a tender as M has just shy of $1 billion of debt maturing over the same time period. Based on management’s target of adjusted EBITDA in the $2.2-to-$2.4 billion range in 2022, coupled with the aforementioned debt reduction, estimates are that leverage can fall to the 2.4x-2.7x range. Lastly, M believes it will have an additional $0.2 billion to $0.8 billion of excess cash, after dividends of $1.4 billion, that can be used for new strategic initiatives or to resume its share repurchase program. Management emphasized they would not resume share repurchases until they have achieved their leverage target.
Exhibit 1. M Cash Flow Breakdown (Cumulative 2020 through 2022)
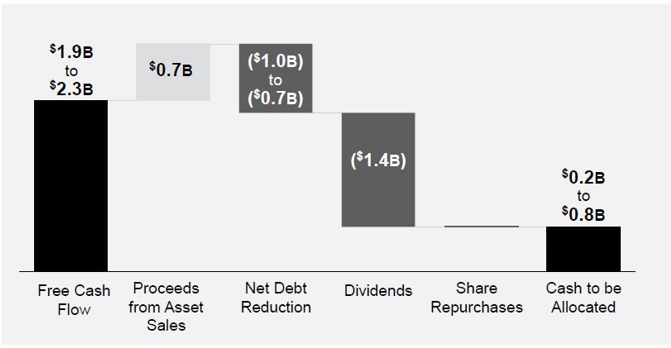
Source: M Analyst Day Presentation
M Bonds Remain in IG Index
While it is anyone’s guess whether Moody’s or Fitch will follow suit, they both currently have stable outlooks on their ratings. S&P was the one agency to waffle back and forth with its outlook revising it to stable in April 2019 and back to negative in November 2019. Despite the downgrade by S&P, Macy’s other ratings are still at the low BBB level, so its roughly $2 billion of eligible bonds will remain in the IG Index. That could provide some support for spreads of its index eligible bonds.
Exhibit 2: Historical spread comparison (M 2.875% vs LB 5.625% 2023)
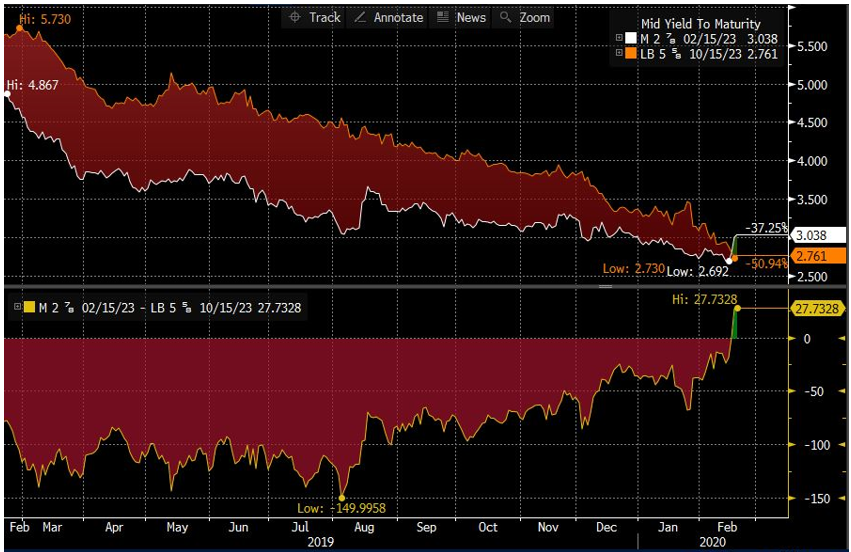
Source: Bloomberg
2023 Bonds Look Interesting
Previously M has been compared to its department store peer Kohls, with a split rating, a better comp is likely L Brands (LB – Ba2(*-)/BB-), particularly as M’s spread levels are more indicative of a HY credit. LB has long managed leverage to the 3.5x area (currently 3.4x) and that is not expected to change much even with the sale of Victoria’s Secret and proceeds going to debt reduction. LB will be reducing debt by roughly $1.0 billion with sale proceeds and cash on hand, which can easily be achieved by executing a MW on the 2021 bonds while doing a partial tender for the 2022 bonds. For the past year, the mean relationship between M 2.875% 2/15/23 bonds has been roughly 85 bp through LB 5.625% 10/15/23 bonds. With M’s downgrade, the relationship in the 2023 bonds between the two credits has reversed. A swap out of LB and into M in this part of the curve provides for a pick of 3 bp (g-spread) while taking out nearly 10 points and shortening 8 months. Furthermore, M’s 5-year CDS currently trades nearly 30 bp through LB’s 5-year CDS.
This material is intended only for institutional investors and does not carry all of the independence and disclosure standards of retail debt research reports. In the preparation of this material, the author may have consulted or otherwise discussed the matters referenced herein with one or more of SCM’s trading desks, any of which may have accumulated or otherwise taken a position, long or short, in any of the financial instruments discussed in or related to this material. Further, SCM may act as a market maker or principal dealer and may have proprietary interests that differ or conflict with the recipient hereof, in connection with any financial instrument discussed in or related to this material.
This message, including any attachments or links contained herein, is subject to important disclaimers, conditions, and disclosures regarding Electronic Communications, which you can find at https://portfolio-strategy.apsec.com/sancap-disclaimers-and-disclosures.
Important Disclaimers
Copyright © 2026 Santander US Capital Markets LLC and its affiliates (“SCM”). All rights reserved. SCM is a member of FINRA and SIPC. This material is intended for limited distribution to institutions only and is not publicly available. Any unauthorized use or disclosure is prohibited.
In making this material available, SCM (i) is not providing any advice to the recipient, including, without limitation, any advice as to investment, legal, accounting, tax and financial matters, (ii) is not acting as an advisor or fiduciary in respect of the recipient, (iii) is not making any predictions or projections and (iv) intends that any recipient to which SCM has provided this material is an “institutional investor” (as defined under applicable law and regulation, including FINRA Rule 4512 and that this material will not be disseminated, in whole or part, to any third party by the recipient.
The author of this material is an economist, desk strategist or trader. In the preparation of this material, the author may have consulted or otherwise discussed the matters referenced herein with one or more of SCM’s trading desks, any of which may have accumulated or otherwise taken a position, long or short, in any of the financial instruments discussed in or related to this material. Further, SCM or any of its affiliates may act as a market maker or principal dealer and may have proprietary interests that differ or conflict with the recipient hereof, in connection with any financial instrument discussed in or related to this material.
This material (i) has been prepared for information purposes only and does not constitute a solicitation or an offer to buy or sell any securities, related investments or other financial instruments, (ii) is neither research, a “research report” as commonly understood under the securities laws and regulations promulgated thereunder nor the product of a research department, (iii) or parts thereof may have been obtained from various sources, the reliability of which has not been verified and cannot be guaranteed by SCM, (iv) should not be reproduced or disclosed to any other person, without SCM’s prior consent and (v) is not intended for distribution in any jurisdiction in which its distribution would be prohibited.
In connection with this material, SCM (i) makes no representation or warranties as to the appropriateness or reliance for use in any transaction or as to the permissibility or legality of any financial instrument in any jurisdiction, (ii) believes the information in this material to be reliable, has not independently verified such information and makes no representation, express or implied, with regard to the accuracy or completeness of such information, (iii) accepts no responsibility or liability as to any reliance placed, or investment decision made, on the basis of such information by the recipient and (iv) does not undertake, and disclaims any duty to undertake, to update or to revise the information contained in this material.
Unless otherwise stated, the views, opinions, forecasts, valuations, or estimates contained in this material are those solely of the author, as of the date of publication of this material, and are subject to change without notice. The recipient of this material should make an independent evaluation of this information and make such other investigations as the recipient considers necessary (including obtaining independent financial advice), before transacting in any financial market or instrument discussed in or related to this material.
Important disclaimers for clients in the EU and UK
This publication has been prepared by Trading Desk Strategists within the Sales and Trading functions of Santander US Capital Markets LLC (“SanCap”), the US registered broker-dealer of Santander Corporate & Investment Banking. This communication is distributed in the EEA by Banco Santander S.A., a credit institution registered in Spain and authorised and regulated by the Bank of Spain and the CNMV. Any EEA recipient of this communication that would like to affect any transaction in any security or issuer discussed herein should do so with Banco Santander S.A. or any of its affiliates (together “Santander”). This communication has been distributed in the UK by Banco Santander, S.A.’s London branch, authorised by the Bank of Spain and subject to regulatory oversight on certain matters by the Financial Conduct Authority (FCA) and the Prudential Regulation Authority (PRA).
The publication is intended for exclusive use for Professional Clients and Eligible Counterparties as defined by MiFID II and is not intended for use by retail customers or for any persons or entities in any jurisdictions or country where such distribution or use would be contrary to local law or regulation.
This material is not a product of Santander´s Research Team and does not constitute independent investment research. This is a marketing communication and may contain ¨investment recommendations¨ as defined by the Market Abuse Regulation 596/2014 ("MAR"). This publication has not been prepared in accordance with legal requirements designed to promote the independence of research and is not subject to any prohibition on dealing ahead of the dissemination of investment research. The author, date and time of the production of this publication are as indicated herein.
This publication does not constitute investment advice and may not be relied upon to form an investment decision, nor should it be construed as any offer to sell or issue or invitation to purchase, acquire or subscribe for any instruments referred herein. The publication has been prepared in good faith and based on information Santander considers reliable as of the date of publication, but Santander does not guarantee or represent, express or implied, that such information is accurate or complete. All estimates, forecasts and opinions are current as at the date of this publication and are subject to change without notice. Unless otherwise indicated, Santander does not intend to update this publication. The views and commentary in this publication may not be objective or independent of the interests of the Trading and Sales functions of Santander, who may be active participants in the markets, investments or strategies referred to herein and/or may receive compensation from investment banking and non-investment banking services from entities mentioned herein. Santander may trade as principal, make a market or hold positions in instruments (or related derivatives) and/or hold financial interest in entities discussed herein. Santander may provide market commentary or trading strategies to other clients or engage in transactions which may differ from views expressed herein. Santander may have acted upon the contents of this publication prior to you having received it.
This publication is intended for the exclusive use of the recipient and must not be reproduced, redistributed or transmitted, in whole or in part, without Santander’s consent. The recipient agrees to keep confidential at all times information contained herein.


