


Uncategorized
The value of selecting the right servicer for FHA loans
admin | February 14, 2020
This document is intended for institutional investors and is not subject to all of the independence and disclosure standards applicable to debt research reports prepared for retail investors.
Mortgage servicers can heavily influence a borrower’s likelihood to prepay and the prepayment speeds of MBS pools. This is especially true in Ginnie Mae MBS, which tend to prepay relatively quickly since borrowers have access to streamlined refinancing programs. It is well known that certain servicers’ VA loans prepay much faster than others, but this is also true of FHA loans. In fact, servicer selection might be more important for FHA loans than either VA or conventional loans. Investors able to take the lower liquidity of Ginnie Mae custom pools can capitalize on the differences across FHA servicers.
The choice of servicer is more important in Ginnie Mae MBS
Each month Amherst Pierpont publishes servicer prepayment rankings, which measure the unique effect that a servicer has on its pools’ prepayment speeds. Reviewing the rankings over the last few months shows a wider spread between the fastest and slowest servicers on Ginnie Mae pools compared to conventional pools.
For example, on the February report showing speeds in January, Quicken and Freedom showed up as the fastest two Ginnie Mae 30-year servicers, roughly 60% faster than their peers over the last three months. Two of the slower servicers were Navy Federal Credit Union and USAA, each roughly 40% to 50% slower than their peers. The spread difference from fastest to slowest is therefore more than 100%. However, in GSE 30-year MBS, Quicken was 47% faster and USAA was 33% slower—only an 80% difference.
Recent prepayment speeds for the largest servicers’ 4.0% pools show the difference clearly (Exhibit 1). United Shore and US Bank showed up as the fastest and slowest conventional servicers respectively. United Shore’s loans prepaid roughly 72% faster than U.S. Bank’s. The speed gap was much wider in FHA loans, with Freedom and Quicken—the two fastest—prepaying 140% faster than U.S. Bank—the slowest. Finally, the fastest VA lender was Freedom, which prepaid 87% faster than the slowest lender—Wells Fargo
Incidentally, the 4.0% coupon has sufficient data to show the full seasoning ramp, and it is useful to see the ramp to assess the prepayment spike at six and seven months of seasoning. Prepayment speeds are shown in SMM in addition to CPR, since at fast speeds CPR comparisons understate the true difference in speeds.
Exhibit 1: 4.0% MBS prepayment speeds—conventional, FHA, and VA
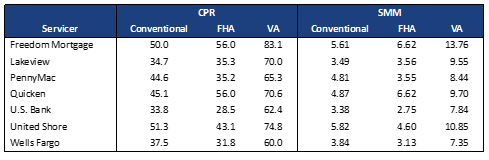
Note: Loans are in 4.0% coupon pools, owner occupied, ≥$225k original loan size, and <50 bp spread at origination. Performance from July 2019 through January 2020. United Shore includes all loans they sold, regardless of the current servicer. Source: Fannie Mae, Freddie Mac, eMBS, Amherst Pierpont Securities
Servicer matters when creating 0% VA pools
It is interesting to notice that the servicer had the largest influence on FHA speeds. The reason is that a VA borrower is naturally more likely to refinance, so even a less aggressive lender’s loans will prepay quickly. And the greater refinance frictions facing a conventional borrower reduce the ability of a servicer to induce faster prepayments.
Furthermore, prepayment speeds on the fastest FHA servicer, Freedom Mortgage, weren’t much better than those of the slowest VA servicer, Wells Fargo. A 100% Freedom FHA pool will generally prepay better than a pool formed of typical VA loans, but the multi pools that drive TBA pricing are a blend of FHA and VA loans. Exhibit 2 uses the same group of 4.0% coupon FHA and VA loans, and compares the average seasoning ramp to the ramp of Freedom and U.S. Bank and the average FHA loan.
Exhibit 2: Not all FHA servicers outperform the cohort
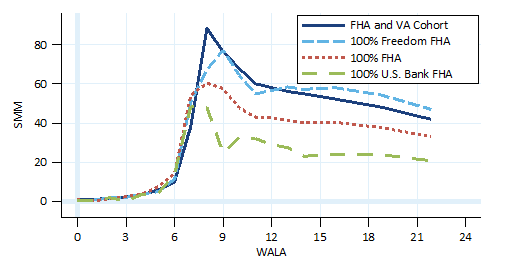
Note: Loans are in 4.0% coupon pools, owner occupied, ≥$225k original loan size, and <50 bp spread at origination. Performance from July 2019 through January 2020. United Shore includes all loans they sold, regardless of the current servicer. Source: Fannie Mae, Freddie Mac, eMBS, Amherst Pierpont Securities
The Freedom FHA loans prepay very similarly to the cohort, and should probably trade flat to the TBA. The average FHA loan prepays much better than the cohort, and U.S. Bank shows that some servicers significantly outperform the FHA average. Therefore servicer selection is very important to maximizing the value of FHA-only pools.
Investors can really only capitalize on differences across FHA servicers by creating Ginnie Mae custom pools, which are not TBA-deliverable. The loss of liquidity and the option to deliver into a strong dollar-roll are worth something, so custom pools often trade behind TBA. But the potential for better carry and convexity should add up in the long run.