Uncategorized
The steady footrace between mutual funds and ETFs
admin | February 14, 2020
This material is a Marketing Communication and does not constitute Independent Investment Research.
Most managers of mutual funds have heard the footsteps of exchange traded funds for well over a decade, but the fixed income crew is faring better in the race than the equity crew. Fixed income mutual funds have grown faster than competing ETFs in recent years while equity mutual funds have fallen far behind. The difference arguably may be the greater ability of fixed income managers to invest in assets outside of benchmark indices and the challenges of building fixed income ETFs.
Cumulative inflows into taxable fixed income mutual funds have outpaced flows into similar ETFs since early 2017 by $107 billion, according to the Investment Company Institute (Exhibit 1). The mutual funds lost a sizable chunk of assets in late 2018 as Fed policy tightened, recession concerns rose and credit spreads widened. But the funds have since recovered lost ground. ETFs flows have run at a slower but much steadier pace. The advantage for funds follows a 10-year run where flows into competing fixed income mutual funds and ETFs roughly matched.
Exhibit 1: Taxable fixed income mutual funds have gained ground on ETFs
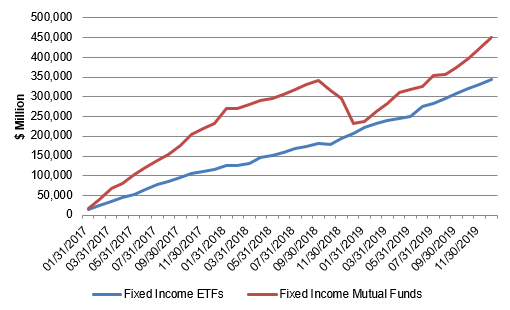
Source: Investment Company Institute, Amherst Pierpont Securities
The experience for taxable fixed income mutual funds stands in stark contrast to equity mutual funds, which have fallen behind equity ETFs since early 2017 by $1.2 trillion (Exhibit 2). That comes after a 10-year period where equity mutual funds already had fallen behind equity ETFs by nearly $5 trillion. In the equity business, ETFs have steadily taken the field.
Exhibit 2: Equity mutual funds have steadily lost ground to equity ETFs
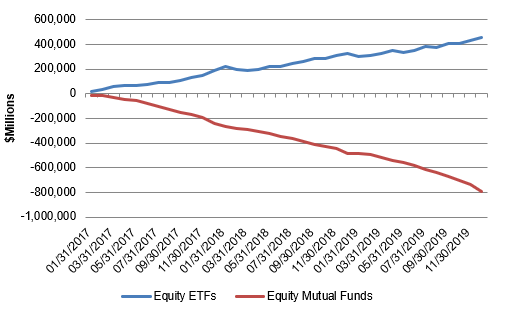
Source: Investment Company Institute, Amherst Pierpont Securities
The difference between taxable fixed income and equity in the competition between mutual funds and ETFs begs for an explanation, and several seem plausible, especially the opportunity to invest outside of the main indices and the complexity of engineering an ETF.
Fixed income managers may have an easier time generating excess return over an index, especially by investing in diversifying assets outside the index. The Bloomberg Barclays US Aggregate Bond Index, for instance, only includes investment grade instruments with a minimum size, opening the door to excess return from smaller and often less liquid instruments. The index also does not include most non-agency MBS or CLOs, opening the door to excess return from those markets. The index also leaves out CMOs, allowing a manager to take advantage of relative value in that market or to add embedded leverage through interest-only or inverse interest-only securities. Unfortunately, rigorous tests of fixed income mutual funds’ ability to beat broad indices are in short supply.
Investing outside an equity index such as the S&P 500 likely is relatively harder. Equity investors can clearly invest in issuers with market cap or public float that falls below the S&P 500 thresholds or in non-US public companies. And while mutual funds could invest in private equity, regulatory and practical limits on illiquid securities arguably cap the opportunity. Plenty of work on equity mutual funds’ performance against broad indices shows limited sustained excess return.
Another plausible difference between taxable fixed income and equity is the complexity of creating a broad market ETF—harder in fixed income than in equity. The Bloomberg Barclays Aggregate Bond Index as of February, for instance, includes 11,120 distinct securities, many that rarely trade even though the securities get priced daily. The number of listed securities and the infrequent trading make it nearly impossible to replicate the index holdings, so creators of ETFs have to approximate the index by other means. The S&P 500, in contrast, includes a much smaller number of securities with quoted prices on public exchanges, making it relatively straightforward to replicate index holdings.
Fixed income mutual funds still face significant competition from ETFs, and that’s especially true of mutual funds that hold a large share of the portfolio in index assets with weightings that match the index—funds, in other words, that are closet indexers. Closest indexers eventually have to compete on price, and that’s a losing proposition against most ETFs. But the last few years suggest fixed income managers can stay ahead of ETFs much more successfully than their equity cousins.
* * *
The view in rates
The coronavirus continues to shape the outlook for global growth and inflation and the level and shape of US rates. Even though the magnitude and mortality of the outbreak remains to be seen, the initial impact on China’s economy is clear and worrisome since China last year contributed 19% of global GDP. Expanding quarantines in China and voluntary and imposed restrictions on travel there have idled significant resources. It is likely that pent up demand will resurface once there’s clarity on the coronavirus and GDP should partially if bit fully rebound. Given the emerging scientific and public health collaboration to address the outbreak, it seems likely that the uncertainty around the outbreak will fall quickly. As it falls, rates should rise and the yield curve steepen.
The view in spreads
Despite concerns about China and global growth and inflation, the appetite for spread and compounding income is still strong. Investors have clearly stepped back at times to watch the coronavirus play out, but the trend seems to be increasingly to step back in. The US economy looks healthy enough to keep credit concerns at bay for investment grade companies and even most high yield companies, so spreads have room to compress further once uncertainty around the virus drops. MBS has some room to run tighter even though low rates stand to keep prepayments elevated through the spring, especially in Ginnie Mae MBS. If the economy moves above current expectations of less than 2% real GDP growth, spreads should tighten further.
The view in credit
A variety of measures of corporate leverage remain high, but leverage spells trouble only if growth falls below current expectations and financing for leveraged borrowers tightens. The downgrade of Kraft Heinz highlights the risk that some highly leveraged companies run with a world with sub-2% GDP growth, but that shouldn’t come as a surprise. It looks more likely that growth might slightly exceed expectations, lifting corporate fundaments. As for the consumer, that is a story of generally continued strength with low unemployment, strong income, rising net worth and low debt service as a share of income.
This material is intended only for institutional investors and does not carry all of the independence and disclosure standards of retail debt research reports. In the preparation of this material, the author may have consulted or otherwise discussed the matters referenced herein with one or more of SCM’s trading desks, any of which may have accumulated or otherwise taken a position, long or short, in any of the financial instruments discussed in or related to this material. Further, SCM may act as a market maker or principal dealer and may have proprietary interests that differ or conflict with the recipient hereof, in connection with any financial instrument discussed in or related to this material.
This message, including any attachments or links contained herein, is subject to important disclaimers, conditions, and disclosures regarding Electronic Communications, which you can find at https://portfolio-strategy.apsec.com/sancap-disclaimers-and-disclosures.
Important Disclaimers
Copyright © 2026 Santander US Capital Markets LLC and its affiliates (“SCM”). All rights reserved. SCM is a member of FINRA and SIPC. This material is intended for limited distribution to institutions only and is not publicly available. Any unauthorized use or disclosure is prohibited.
In making this material available, SCM (i) is not providing any advice to the recipient, including, without limitation, any advice as to investment, legal, accounting, tax and financial matters, (ii) is not acting as an advisor or fiduciary in respect of the recipient, (iii) is not making any predictions or projections and (iv) intends that any recipient to which SCM has provided this material is an “institutional investor” (as defined under applicable law and regulation, including FINRA Rule 4512 and that this material will not be disseminated, in whole or part, to any third party by the recipient.
The author of this material is an economist, desk strategist or trader. In the preparation of this material, the author may have consulted or otherwise discussed the matters referenced herein with one or more of SCM’s trading desks, any of which may have accumulated or otherwise taken a position, long or short, in any of the financial instruments discussed in or related to this material. Further, SCM or any of its affiliates may act as a market maker or principal dealer and may have proprietary interests that differ or conflict with the recipient hereof, in connection with any financial instrument discussed in or related to this material.
This material (i) has been prepared for information purposes only and does not constitute a solicitation or an offer to buy or sell any securities, related investments or other financial instruments, (ii) is neither research, a “research report” as commonly understood under the securities laws and regulations promulgated thereunder nor the product of a research department, (iii) or parts thereof may have been obtained from various sources, the reliability of which has not been verified and cannot be guaranteed by SCM, (iv) should not be reproduced or disclosed to any other person, without SCM’s prior consent and (v) is not intended for distribution in any jurisdiction in which its distribution would be prohibited.
In connection with this material, SCM (i) makes no representation or warranties as to the appropriateness or reliance for use in any transaction or as to the permissibility or legality of any financial instrument in any jurisdiction, (ii) believes the information in this material to be reliable, has not independently verified such information and makes no representation, express or implied, with regard to the accuracy or completeness of such information, (iii) accepts no responsibility or liability as to any reliance placed, or investment decision made, on the basis of such information by the recipient and (iv) does not undertake, and disclaims any duty to undertake, to update or to revise the information contained in this material.
Unless otherwise stated, the views, opinions, forecasts, valuations, or estimates contained in this material are those solely of the author, as of the date of publication of this material, and are subject to change without notice. The recipient of this material should make an independent evaluation of this information and make such other investigations as the recipient considers necessary (including obtaining independent financial advice), before transacting in any financial market or instrument discussed in or related to this material.
Important disclaimers for clients in the EU and UK
This publication has been prepared by Trading Desk Strategists within the Sales and Trading functions of Santander US Capital Markets LLC (“SanCap”), the US registered broker-dealer of Santander Corporate & Investment Banking. This communication is distributed in the EEA by Banco Santander S.A., a credit institution registered in Spain and authorised and regulated by the Bank of Spain and the CNMV. Any EEA recipient of this communication that would like to affect any transaction in any security or issuer discussed herein should do so with Banco Santander S.A. or any of its affiliates (together “Santander”). This communication has been distributed in the UK by Banco Santander, S.A.’s London branch, authorised by the Bank of Spain and subject to regulatory oversight on certain matters by the Financial Conduct Authority (FCA) and the Prudential Regulation Authority (PRA).
The publication is intended for exclusive use for Professional Clients and Eligible Counterparties as defined by MiFID II and is not intended for use by retail customers or for any persons or entities in any jurisdictions or country where such distribution or use would be contrary to local law or regulation.
This material is not a product of Santander´s Research Team and does not constitute independent investment research. This is a marketing communication and may contain ¨investment recommendations¨ as defined by the Market Abuse Regulation 596/2014 ("MAR"). This publication has not been prepared in accordance with legal requirements designed to promote the independence of research and is not subject to any prohibition on dealing ahead of the dissemination of investment research. The author, date and time of the production of this publication are as indicated herein.
This publication does not constitute investment advice and may not be relied upon to form an investment decision, nor should it be construed as any offer to sell or issue or invitation to purchase, acquire or subscribe for any instruments referred herein. The publication has been prepared in good faith and based on information Santander considers reliable as of the date of publication, but Santander does not guarantee or represent, express or implied, that such information is accurate or complete. All estimates, forecasts and opinions are current as at the date of this publication and are subject to change without notice. Unless otherwise indicated, Santander does not intend to update this publication. The views and commentary in this publication may not be objective or independent of the interests of the Trading and Sales functions of Santander, who may be active participants in the markets, investments or strategies referred to herein and/or may receive compensation from investment banking and non-investment banking services from entities mentioned herein. Santander may trade as principal, make a market or hold positions in instruments (or related derivatives) and/or hold financial interest in entities discussed herein. Santander may provide market commentary or trading strategies to other clients or engage in transactions which may differ from views expressed herein. Santander may have acted upon the contents of this publication prior to you having received it.
This publication is intended for the exclusive use of the recipient and must not be reproduced, redistributed or transmitted, in whole or in part, without Santander’s consent. The recipient agrees to keep confidential at all times information contained herein.


