Uncategorized
Screening for relative value in CRT last cash flows
admin | February 14, 2020
This material is a Marketing Communication and does not constitute Independent Investment Research.
Credit spread tightening coupled with low rates and fast prepayments have put almost all Fannie Mae and Freddie Mac CRT last cash flow classes above par, and prepayment risk has trumped credit risk when trying to mine for relative value. As a result, higher premium 2016 and 2019 last cash flows may offer some the most attractive relative value. They seem priced to overly aggressive prepayment assumptions, undervaluing the embedded IO.
CRT ‘last cash flows’ are somewhat of a misnomer in that the moniker actually refers to the junior mezzanine tranche of CRT deals with sequentially tranched subordinate B classes beneath them. Given the sequential structure that the GSEs employ in their credit risk transfer programs, these mezzanine classes should tighten as the structure de-levers and the junior mezzanine or M2 class of most deals becomes the current pay bond. The structure affords investors a potentially attractive source of total return as the deals de-lever. In addition to spread compression through deleveraging, these mezzanine bonds have experienced far greater spread tightening than other mezzanine bonds like RPL BBBs which also employ a sequential structure and RMBS 2.0 BBB classes. (Exhibit 1)
Exhibit 1: CRT M2s have tightened more than other residential credit
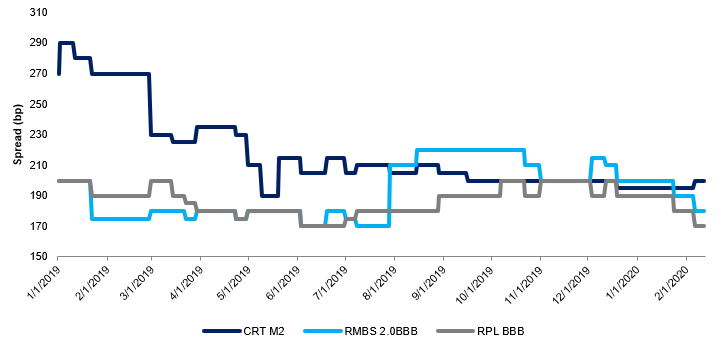
Source: Bloomberg, LCD Research, Amherst Pierpont Securities
As a result of overall spread tightening and prepayment risk, certain collateral profiles may provide better carry and total return than others. In constructing a framework for relative value, the universe of last cash flows is effectively bifurcated into two groups, last cash flows that are current pay and those that are still locked out. Fast speeds have pushed a disproportionately large amount of the last cash flow universe to either open pay or rapidly approaching opening up. In fact bonds issued as recently as the first half of 2019 are already open window. Carry associated with premium IO will likely be the largest driver of outperformance and as such OAS becomes the primary driver of relative value for the majority of the universe.
Most of the last cash flow universe trades with negative effective duration, so to establish some idea of risk and return, OAS is mapped against average life instead. Based on this framework, it appears that higher premium higher coupon M2 and M3s issued in 2016 and 2019 may offer some of the most attractive relative value. This is likely a result of mispricing these bonds to overly aggressive prepayment assumptions, which may not be realized over a longer horizon. Some examples of this are STACR HQA1 and DNA1 M3 and STACR 2019-HQA4 M2. Amherst’s proprietary long –term prepayment projections on the 2016 bonds are 12 CPR and 11 CPR respectively and 18 CPR for the 2019 STACR bond. The 2016 HQA deal is currently prepaying at a 6-month speed of 18 CPR and at a roughly $112 price, the difference between the 6-month average CPR and Amherst’s projected long term average speed equates to 150 bp difference in nominal spread. (Exhibit 2) And by contrast, the majority of 2014, 2015 and 2018 vintage bonds appear to be overvalued.
Exhibit 2: Higher coupon, higher premium last cash flows may be undervalued
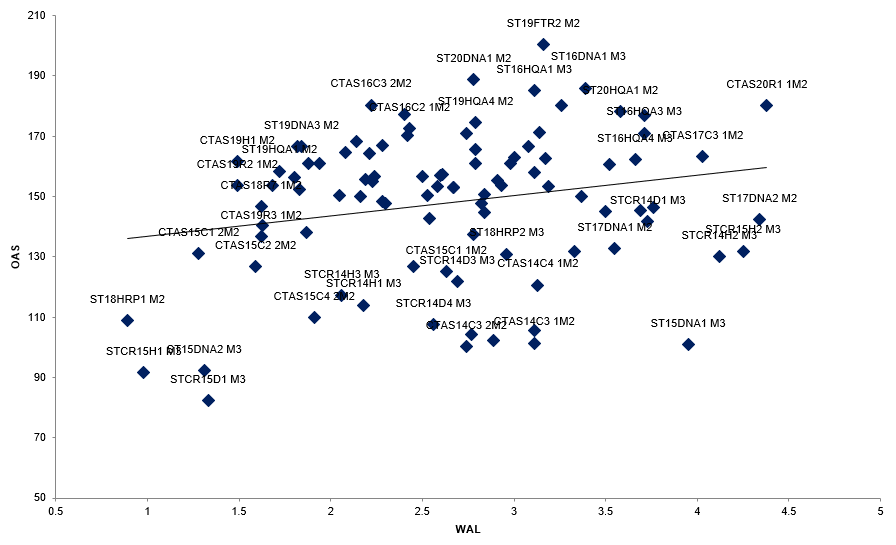
Note: Pricing as of 2/12//20. Source: Vista, Amherst Pierpont Securities
Comparing OAS and prepayment projections across the las cash flow universe versus Yieldbook projections shows that proprietary prepayment projections are slower for the overwhelming majority of the universe. This is largely attributable to faster burnout in the proprietary model which appears to be in line with empirical speeds. Given this, the disparity will be more pronounced in moderately seasoned bonds that are projected to hit terminal speeds sooner and less pronounced in more highly seasoned collateral that are already burnt out.
Given almost the entirety of the universe trades at a meaningful premium to par, slower prepayment projections translate to wider OAS—in some cases substantially wider. Unsurprisingly, these differences are most pronounced in deals backed by loans that are roughly 36 WALA or greater as 2016 vintage deals show the widest OAS differential since these bonds were issued with some of the largest stated coupons against the backdrop of the meltdown in high yield in the first quarter of that year and subsequently trade at some of the highest premiums. (Exhibit 3) No model is foolproof, of course, and higher OAS can represent a premium for taking the risk that actual speeds diverge from model projections. Still, investors looking to extract relative value from open window CRT last cash flows potentially have significantly more upside to outperform on bonds with greater carry against the backdrop of slower long term speeds.
Exhibit 3: Slower speeds and bigger premiums drive wider OAS
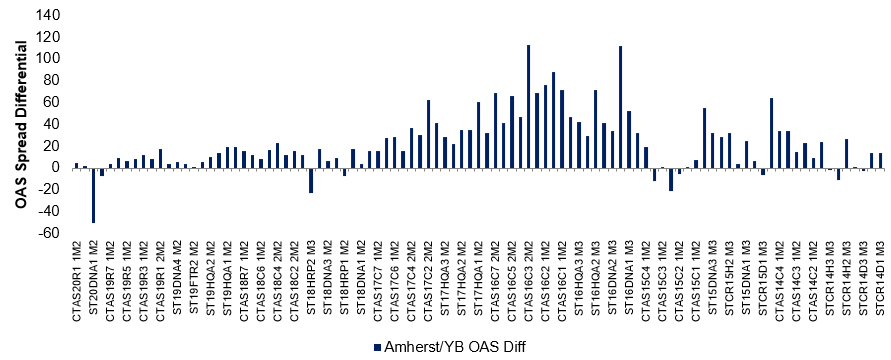
Source: Amherst Pierpont Securities
This material is intended only for institutional investors and does not carry all of the independence and disclosure standards of retail debt research reports. In the preparation of this material, the author may have consulted or otherwise discussed the matters referenced herein with one or more of SCM’s trading desks, any of which may have accumulated or otherwise taken a position, long or short, in any of the financial instruments discussed in or related to this material. Further, SCM may act as a market maker or principal dealer and may have proprietary interests that differ or conflict with the recipient hereof, in connection with any financial instrument discussed in or related to this material.
This message, including any attachments or links contained herein, is subject to important disclaimers, conditions, and disclosures regarding Electronic Communications, which you can find at https://portfolio-strategy.apsec.com/sancap-disclaimers-and-disclosures.
Important Disclaimers
Copyright © 2026 Santander US Capital Markets LLC and its affiliates (“SCM”). All rights reserved. SCM is a member of FINRA and SIPC. This material is intended for limited distribution to institutions only and is not publicly available. Any unauthorized use or disclosure is prohibited.
In making this material available, SCM (i) is not providing any advice to the recipient, including, without limitation, any advice as to investment, legal, accounting, tax and financial matters, (ii) is not acting as an advisor or fiduciary in respect of the recipient, (iii) is not making any predictions or projections and (iv) intends that any recipient to which SCM has provided this material is an “institutional investor” (as defined under applicable law and regulation, including FINRA Rule 4512 and that this material will not be disseminated, in whole or part, to any third party by the recipient.
The author of this material is an economist, desk strategist or trader. In the preparation of this material, the author may have consulted or otherwise discussed the matters referenced herein with one or more of SCM’s trading desks, any of which may have accumulated or otherwise taken a position, long or short, in any of the financial instruments discussed in or related to this material. Further, SCM or any of its affiliates may act as a market maker or principal dealer and may have proprietary interests that differ or conflict with the recipient hereof, in connection with any financial instrument discussed in or related to this material.
This material (i) has been prepared for information purposes only and does not constitute a solicitation or an offer to buy or sell any securities, related investments or other financial instruments, (ii) is neither research, a “research report” as commonly understood under the securities laws and regulations promulgated thereunder nor the product of a research department, (iii) or parts thereof may have been obtained from various sources, the reliability of which has not been verified and cannot be guaranteed by SCM, (iv) should not be reproduced or disclosed to any other person, without SCM’s prior consent and (v) is not intended for distribution in any jurisdiction in which its distribution would be prohibited.
In connection with this material, SCM (i) makes no representation or warranties as to the appropriateness or reliance for use in any transaction or as to the permissibility or legality of any financial instrument in any jurisdiction, (ii) believes the information in this material to be reliable, has not independently verified such information and makes no representation, express or implied, with regard to the accuracy or completeness of such information, (iii) accepts no responsibility or liability as to any reliance placed, or investment decision made, on the basis of such information by the recipient and (iv) does not undertake, and disclaims any duty to undertake, to update or to revise the information contained in this material.
Unless otherwise stated, the views, opinions, forecasts, valuations, or estimates contained in this material are those solely of the author, as of the date of publication of this material, and are subject to change without notice. The recipient of this material should make an independent evaluation of this information and make such other investigations as the recipient considers necessary (including obtaining independent financial advice), before transacting in any financial market or instrument discussed in or related to this material.
Important disclaimers for clients in the EU and UK
This publication has been prepared by Trading Desk Strategists within the Sales and Trading functions of Santander US Capital Markets LLC (“SanCap”), the US registered broker-dealer of Santander Corporate & Investment Banking. This communication is distributed in the EEA by Banco Santander S.A., a credit institution registered in Spain and authorised and regulated by the Bank of Spain and the CNMV. Any EEA recipient of this communication that would like to affect any transaction in any security or issuer discussed herein should do so with Banco Santander S.A. or any of its affiliates (together “Santander”). This communication has been distributed in the UK by Banco Santander, S.A.’s London branch, authorised by the Bank of Spain and subject to regulatory oversight on certain matters by the Financial Conduct Authority (FCA) and the Prudential Regulation Authority (PRA).
The publication is intended for exclusive use for Professional Clients and Eligible Counterparties as defined by MiFID II and is not intended for use by retail customers or for any persons or entities in any jurisdictions or country where such distribution or use would be contrary to local law or regulation.
This material is not a product of Santander´s Research Team and does not constitute independent investment research. This is a marketing communication and may contain ¨investment recommendations¨ as defined by the Market Abuse Regulation 596/2014 ("MAR"). This publication has not been prepared in accordance with legal requirements designed to promote the independence of research and is not subject to any prohibition on dealing ahead of the dissemination of investment research. The author, date and time of the production of this publication are as indicated herein.
This publication does not constitute investment advice and may not be relied upon to form an investment decision, nor should it be construed as any offer to sell or issue or invitation to purchase, acquire or subscribe for any instruments referred herein. The publication has been prepared in good faith and based on information Santander considers reliable as of the date of publication, but Santander does not guarantee or represent, express or implied, that such information is accurate or complete. All estimates, forecasts and opinions are current as at the date of this publication and are subject to change without notice. Unless otherwise indicated, Santander does not intend to update this publication. The views and commentary in this publication may not be objective or independent of the interests of the Trading and Sales functions of Santander, who may be active participants in the markets, investments or strategies referred to herein and/or may receive compensation from investment banking and non-investment banking services from entities mentioned herein. Santander may trade as principal, make a market or hold positions in instruments (or related derivatives) and/or hold financial interest in entities discussed herein. Santander may provide market commentary or trading strategies to other clients or engage in transactions which may differ from views expressed herein. Santander may have acted upon the contents of this publication prior to you having received it.
This publication is intended for the exclusive use of the recipient and must not be reproduced, redistributed or transmitted, in whole or in part, without Santander’s consent. The recipient agrees to keep confidential at all times information contained herein.


